
Cash or stocks – hoard or invest?
This discussion comes up so often that an analysis post was due.
While I don’t necessarily consider a 100% stock portfolio to be the best investing approach, it will definitely prove a point about assets outperforming cash over the long-term.
Without further ado, let’s break down a case.
The Case
What we’ll analyze is a person’s net-worth if it’s allocated in one of two different asset classes: cash and stocks.
For the purposes of this post, we’ll assume that the person has access to $10k, tax free, and he has no plans of spending them in near future. The goal is to see which strategy will help him maintain his wealth better and maybe even increase it in the process.
Cash Performance in 30 Years
So, let’s say you had $10k available 30 years ago.
Keeping them in your bank account would mean that today you’d have $10k. Great job on not losing them. Here’s a chart to visualize the performance of your portfolio over the years:
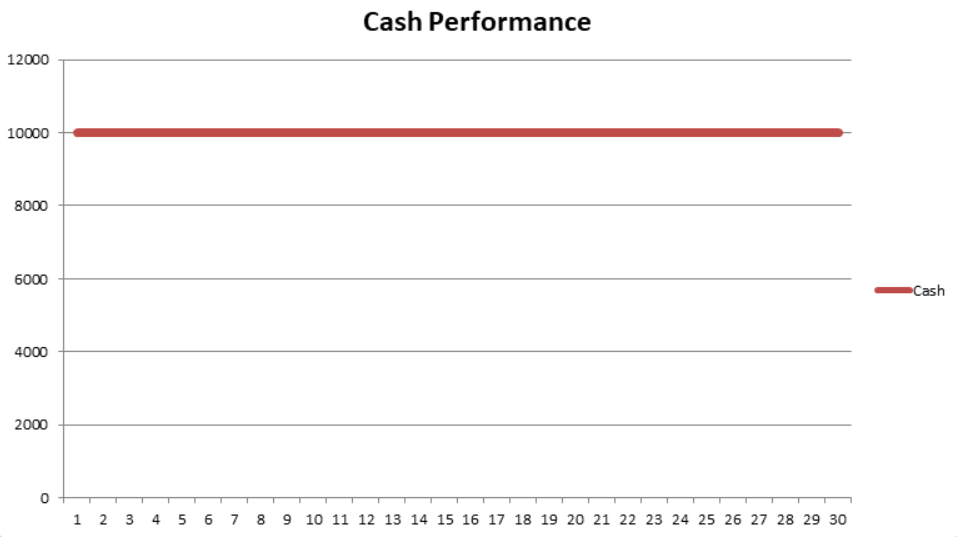
No surprises there.
However, the value of the piece of paper we call a bill is not absolute. It’s determined by what it can actually buy.
And whatever meant $10k 30 years ago doesn’t mean $10k today. In other words: the purchasing power of $10k is much lower today than it was 30 years ago. To put it into perspective by going a few decades back, an average house in the US costed around $17k in 1963.
In what we learned to call “a healthy economy”, the inflation rate is 2-3% per year. I’ll use 2% as a less extreme example:
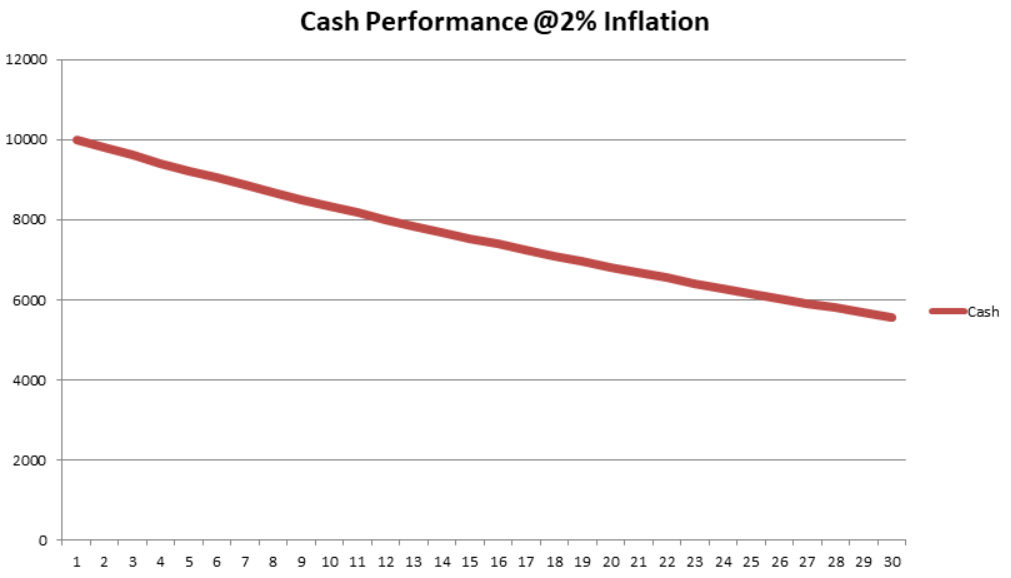
Not cool. And the red line is not a coincidence.
But you don’t have to trust a guy producing simple charts in Excel. Go to any inflation calculator, enter the years of interests and see what actually happens with the value of the money.
I used The Inflation Calculator at westegg.com, and this is the result I got for a 30 year period:
What cost $10000 in 1988 would cost $21427.27 in 2018.
Also, if you were to buy exactly the same products in 2018 and 1988,
they would cost you $10000 and $4568.32 respectively.
Seems like I was actually quite optimistic with my Excel charts.
Long story short: keeping your wealth in cash will reduce your purchasing power because of inflation.
Now okay, n00bs can “hedge” against inflation by using their bank’s savings account. Thirty years ago it might’ve made sense, but the rates offered nowadays hardly match the devaluation of the currency. Nevertheless, I’ll just assume that somehow you beat inflation and conserved the purchasing power of your money. So I’ll use $10k for the cash, although that amount can buy less than half of what it could 30 years ago.
Stock Market Performance in 30 Years
For this example, we will use the S&P 500 index as a benchmark and will assume a lump-sum of $10k for 30 years.
Vanguard introduced the first fund to track the S&P 500 in 1976, so individual investors had the option to “buy the market” conveniently.
Let’s see the actual performance of $10k if we were to dump them in the stock market:
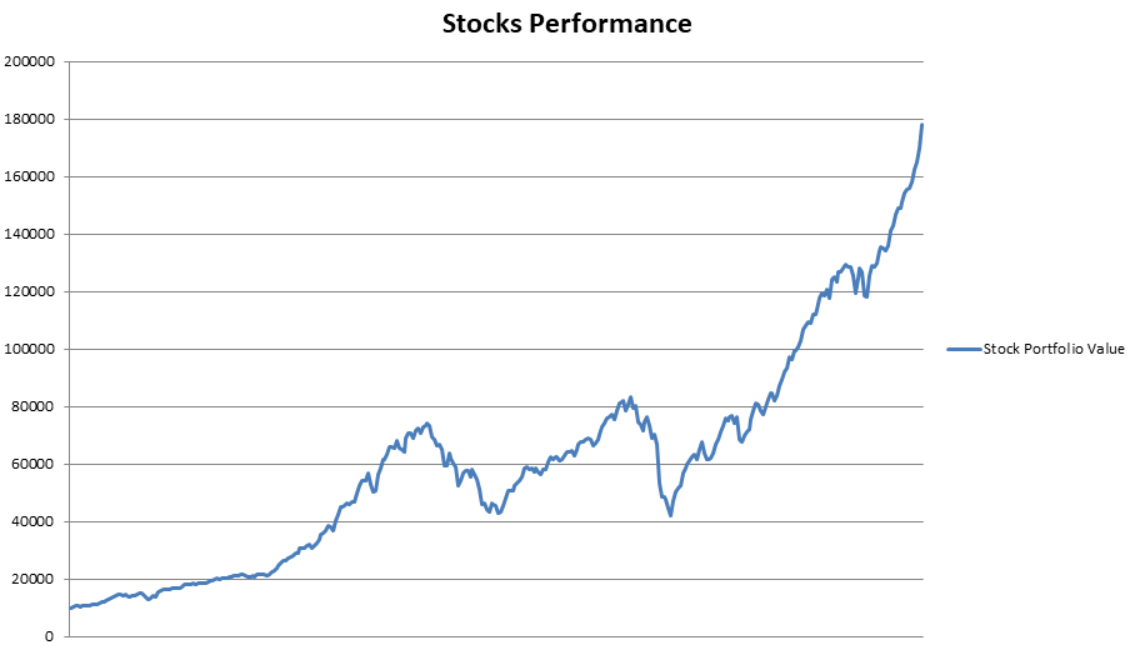
Boom, there are those compounded 10% annual returns!
In regards to total returns, we’re looking at more than 2000% gains over the years. And for a long time, there was no other vehicle for maintaining your wealth like the stock market – and a diversified index as its representative.
Your $10k would be worth $177k after 30 years.
The chart was created by downloading a CSV using the DQYDJ DCA Calculator with a lump-sum of $10k and 0$ in further ongoing contributions. And it includes dividends paid, dividend taxes, capital gains taxes, management fees, and inflation.
And I have to point out that this is a period with two severe recessions: the dot-com crash and the great recession. And holding your wealth in assets was still the clear winner. Let’s go to the unanimous decision and make it official.
Conclusion
Is a picture worth thousand words?
Here’s the comparison of the two approaches:
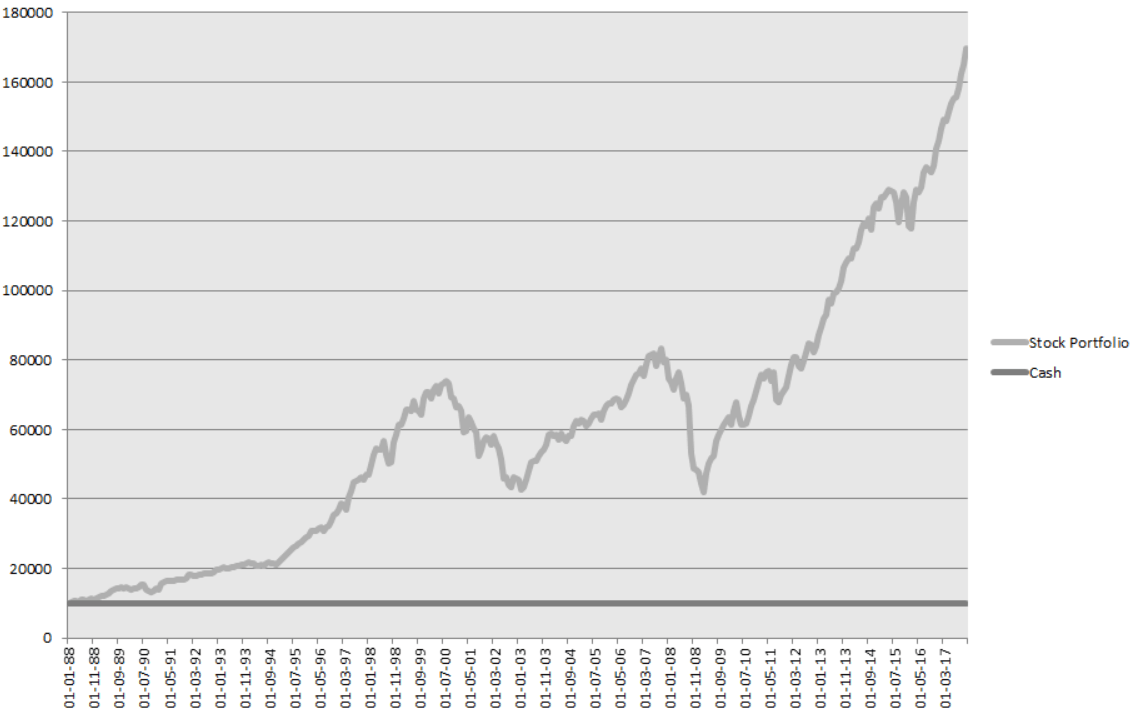
And remember that we’re comparing an inflation adjusted stock portfolio vs a straight line that somehow beat inflation and kept its value over the years.
TLDR: Stocks beat cash in the long-term.
Btw, the time period is not cherry-picked. I’ve actually excluded the stellar performance of the stock market in more recent years.
Nevertheless, you’d come to the same conclusion even if you start measuring right before any recession.
Long-term returns always overshadow any short-term losses.
Afterword
There is no 30 year period in which cash outperformed the total stock market.
If anyone is worried about entering the market right before a recession, he should learn about DCAing. But more importantly, if anyone is worried about losing money, he should learn how they’re created.
And of course, we know that past performance doesn’t guarantee future results. But if we’re using quotes to prove a point, we also know that time in the market beats timing the market.
Continue learning, DYOR, and build long-term wealth the smart way.
Good luck!
For a comprehensive, beginner-friendly, and free resource on stock market investing, visit:
How to Start Investing: A Complete Beginner Series
Author
-

D. Petkovski
📓 The Author Husband & Father
Software Engineer StrengthCentric
 ₿itcoin Hodler Long-Term Investor
🌍 Everything Enthusiast 🔥 Optimist
 Husband & Father
  Software Engineer

Related posts:
 How to Cash Out Millions in the EU Tax Free
 Dividend Investing is for Suckers!
 Why the Stock Market Always Goes Up?
 Asset Allocation – Finding Your Ideal Distribution
 Stock Market Index – Explanation and Examples
 Index Investing & Index Funds – A Gentle Introduction
 IWDA vs VWCE and VWRL (For European Investors)
 Investing Expenses – Full Breakdown
 5 Steps to Overcome Investing Fear
 Inflation Explained
 EU Countries Without Capital Gains Tax (2025)
 IWDA vs SWDA – What’s The Difference?
 Receive Tax Free Dividends in The Netherlands
 Sector Boost With QDVE For ETF Investors
 SPYL vs SPY5 – What to Choose and Why?