After publishing my post on ETFs I received many questions about how to approach picking one.
Understanding stock market indices is crucial for this.
In this post, I’ll cover what is an index and how to use one for your investment strategies.
What is a Stock Market Index?
Directly from Investopedia:
A market index is a hypothetical portfolio of investment holdings that represents a segment of the financial market.
Market Index Use Cases
Let’s say you’re preparing to make an investment decision.
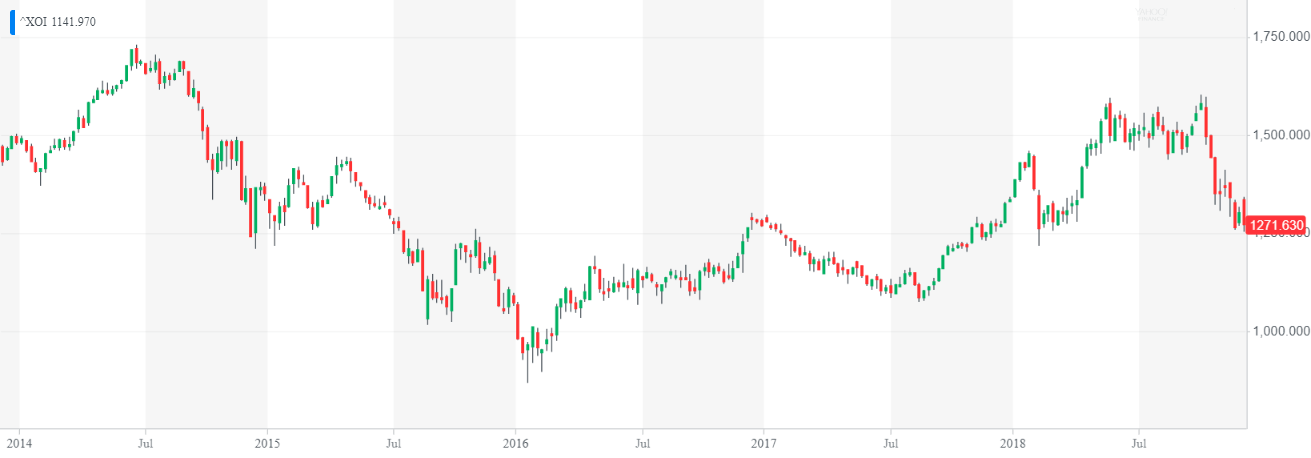
For this, you would like to know the health of the petroleum industry in the recent 3 years.
One way to investigate it is to the performance of the leading companies in the field. Of course, you could do a research for each individual company on your own, but an easier way to understand it is to check the NYSE Arca Oil Index and select 3Y.
What you’d see is the performance of the oil industry.
Have in mind, this value of an index is just an indicator of its performance.
It’s not a number that you could just convert into a currency.
In other words, the value only has relative sense – to represent the index’s change comparing it to its value at some point in the past.
Most Popular Indices
Below are a few examples of various indices that track different countries, sectors, or regions.
Dow Jones Industrial Average
The Dow Jones Industrial Average (DJIA), created in 1896, shows the performance of 30 large publicly traded American companies (such as Cisco, Walmart, Microsoft, Coca Cola, Walt Disney, etc. – click here for full list).
Unlike the index previously described, the DJIA is not bound by an industry but geography – all the companies are based in the United States. The phrase “the market is up” can mean an increase in the value of the Dow for that day.
S&P 500
The S&P 500 is the most popular stock market index.
It tracks stocks from 500 large-cap companies and covers all major areas of the US economy. Unlike the DJIA, it’s a capitalization-weighted index, which means that larger companies have higher percentage weights than the smaller ones.
That means that that it will automatically filter out companies that under-perform, replacing them with those that grew in value.
Back to the status of “the market” – if you google the words “sp500” and “djia”, you will get two charts that look pretty similar to each other, regardless of which period you chose.
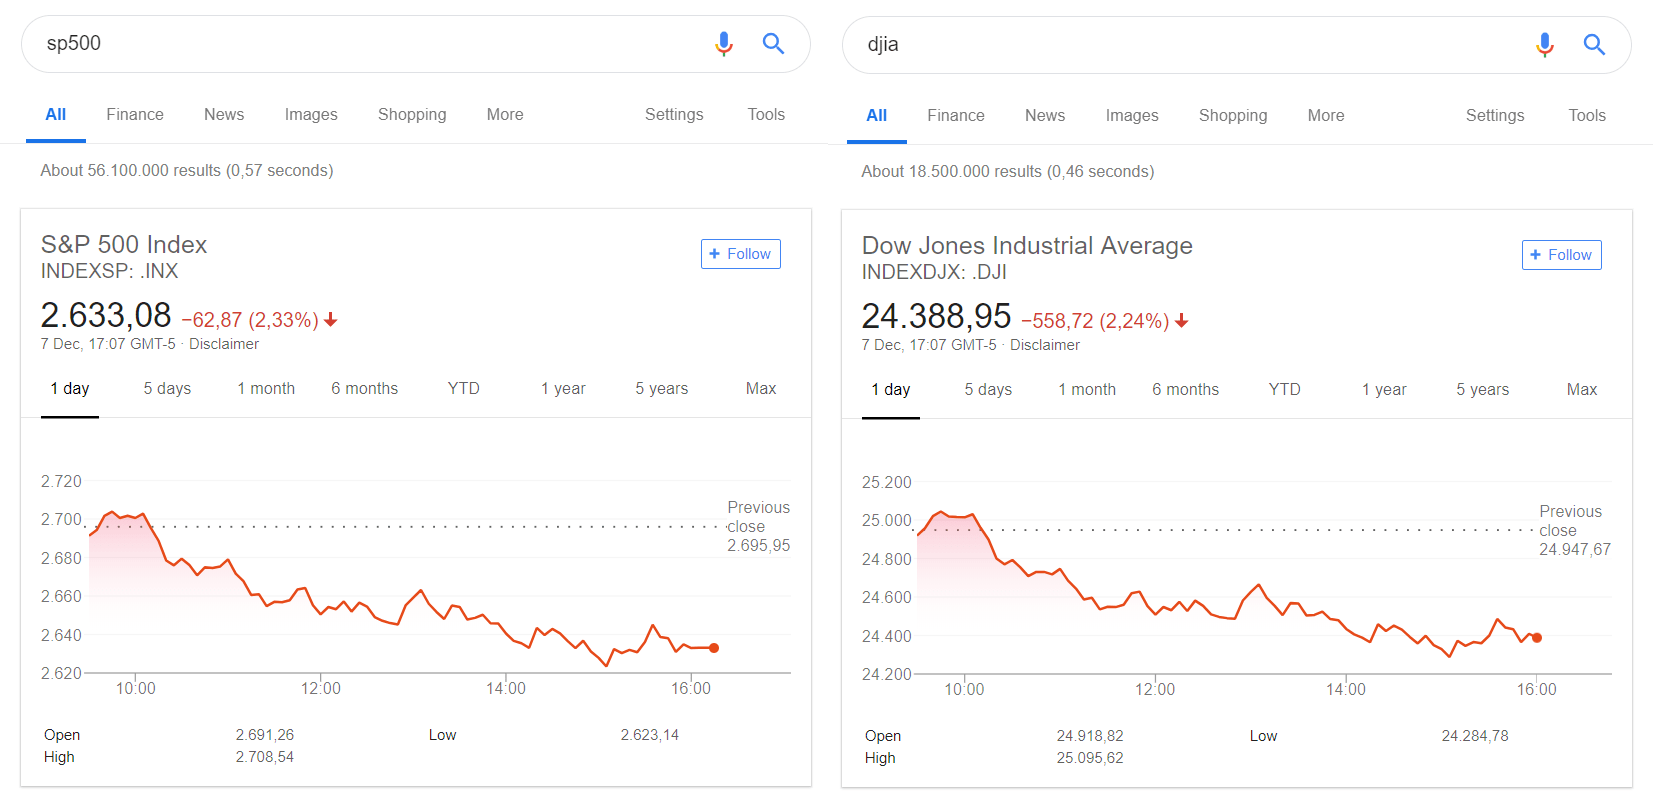
Remember, the numbers 2,633.08 and 24,388.95 don’t show us that the one has “higher value” than the other – they are calculated differently and with different underlying companies.
However, the 2.33% and 2.24% show us that the US stock market went down around 2.3% in the last day.
Other popular indices
Below are a few more market indices, just to give a perspective of the various measures available.
- Nasdaq Composite Index (representing 3000+ stocks trading on the Nasdaq exchange)
- Nasdaq 100 (tracking the largest 100 non-financial companies on Nasdaq)
- MSCI World (tracking >1500 stocks from developed countries all around the world)
- Wilshire 5000 (representing all publicly traded US companies – small, mid, and large cap)
- Russell 2000 (tracking small cap US companies)
- MSCI AEFE (tracking the developed markets outside US and Canada – in Europe, Australia, and Far East)
- FTSE 100 (tracking the 100 largest companies trading on the London stock exchange)
- MSCI Europe ex UK Index (self-explanatory – tracking developed EU markets, excluding the UK)
- Nikkei (tracking top companies trading on the Tokyo stock exchange)
- MSCI Emerging Markets Index (tracking 23 economies from developing countries)
- EURO STOXX 50 (tracking 50 large Eurozone companies), etc., etc., etc.
Wikipedia has a list of all the commonly used stock market indices.
How can Market Indices Help You?
The way to eliminate the company-specific risk as a stock investor is through diversification.
Diversification is the process of distributing capital into various companies with the goal to limit the exposure to any single one.
Let’s say a stock you invested in falls swiftly in price. The more diversified you are, the less impact it will have to your overall portfolio. For example, if your portfolio is composed of only two stocks, a sudden bankruptcy of any company can mean a 50% loss. But if your portfolio has 100s of companies, the performance of the rest will overshadow the losses from that specific one.
The good news is that an index already tracks a basket of companies.
So, instead of trying to pick and manage tens/hundreds of stocks yourself, try to determine the countries/sectors/regions you’re interested in. Then, you can find the adequate index (or a combination of indices) that tracks those and use it as a benchmark for his portfolio.
Remember, this is still “in theory”, so don’t jump to any conclusions.
Instead, head to my post on index investing to learn more.
For a comprehensive, beginner-friendly, and free resource on stock market investing, visit:
How to Start Investing: A Complete Beginner Series
Author
-

D. Petkovski
📓 The Author Husband & Father
Software Engineer StrengthCentric
 ₿itcoin Hodler Long-Term Investor
🌍 Everything Enthusiast 🔥 Optimist
 Husband & Father
  Software Engineer

Related posts:
 Why the Stock Market Always Goes Up?
 Index Investing & Index Funds – A Gentle Introduction
 Market Cap vs Fully Diluted Valuation (FDV) – Explanation & Practical Analysis
 Core Stock Portfolio for EU Investors (ETF Selection & Tips)
 The Best Emerging Market ETF for Europeans
 Lump-Sum Strategy (Time in the Market Done Right)
 Market Order vs Limit Order – Placing Orders Tutorial
 Market Efficiency (Efficient Market Hypothesis)
 The Art of De-Risking: A Mid-Curver’s Take on the Crypto Market
 Total Expense Ratio – The Importance of Keeping it Low
 Dividend Investing is for Suckers!
 CSPX vs VUSA vs IUSA – My Thoughts
 Investment Taxes in ALL EU Countries (2024)
 5 Steps to Overcome Investing Fear
 Not Everything is a Short Squeeze