This post is an extension to Supply and Demand – an Introduction, where we explained supply and demand curves, equilibrium price and quantity, and aggregate supply and demand.
In this post we’ll understand what consumer surplus and producer surplus are.
Reminder
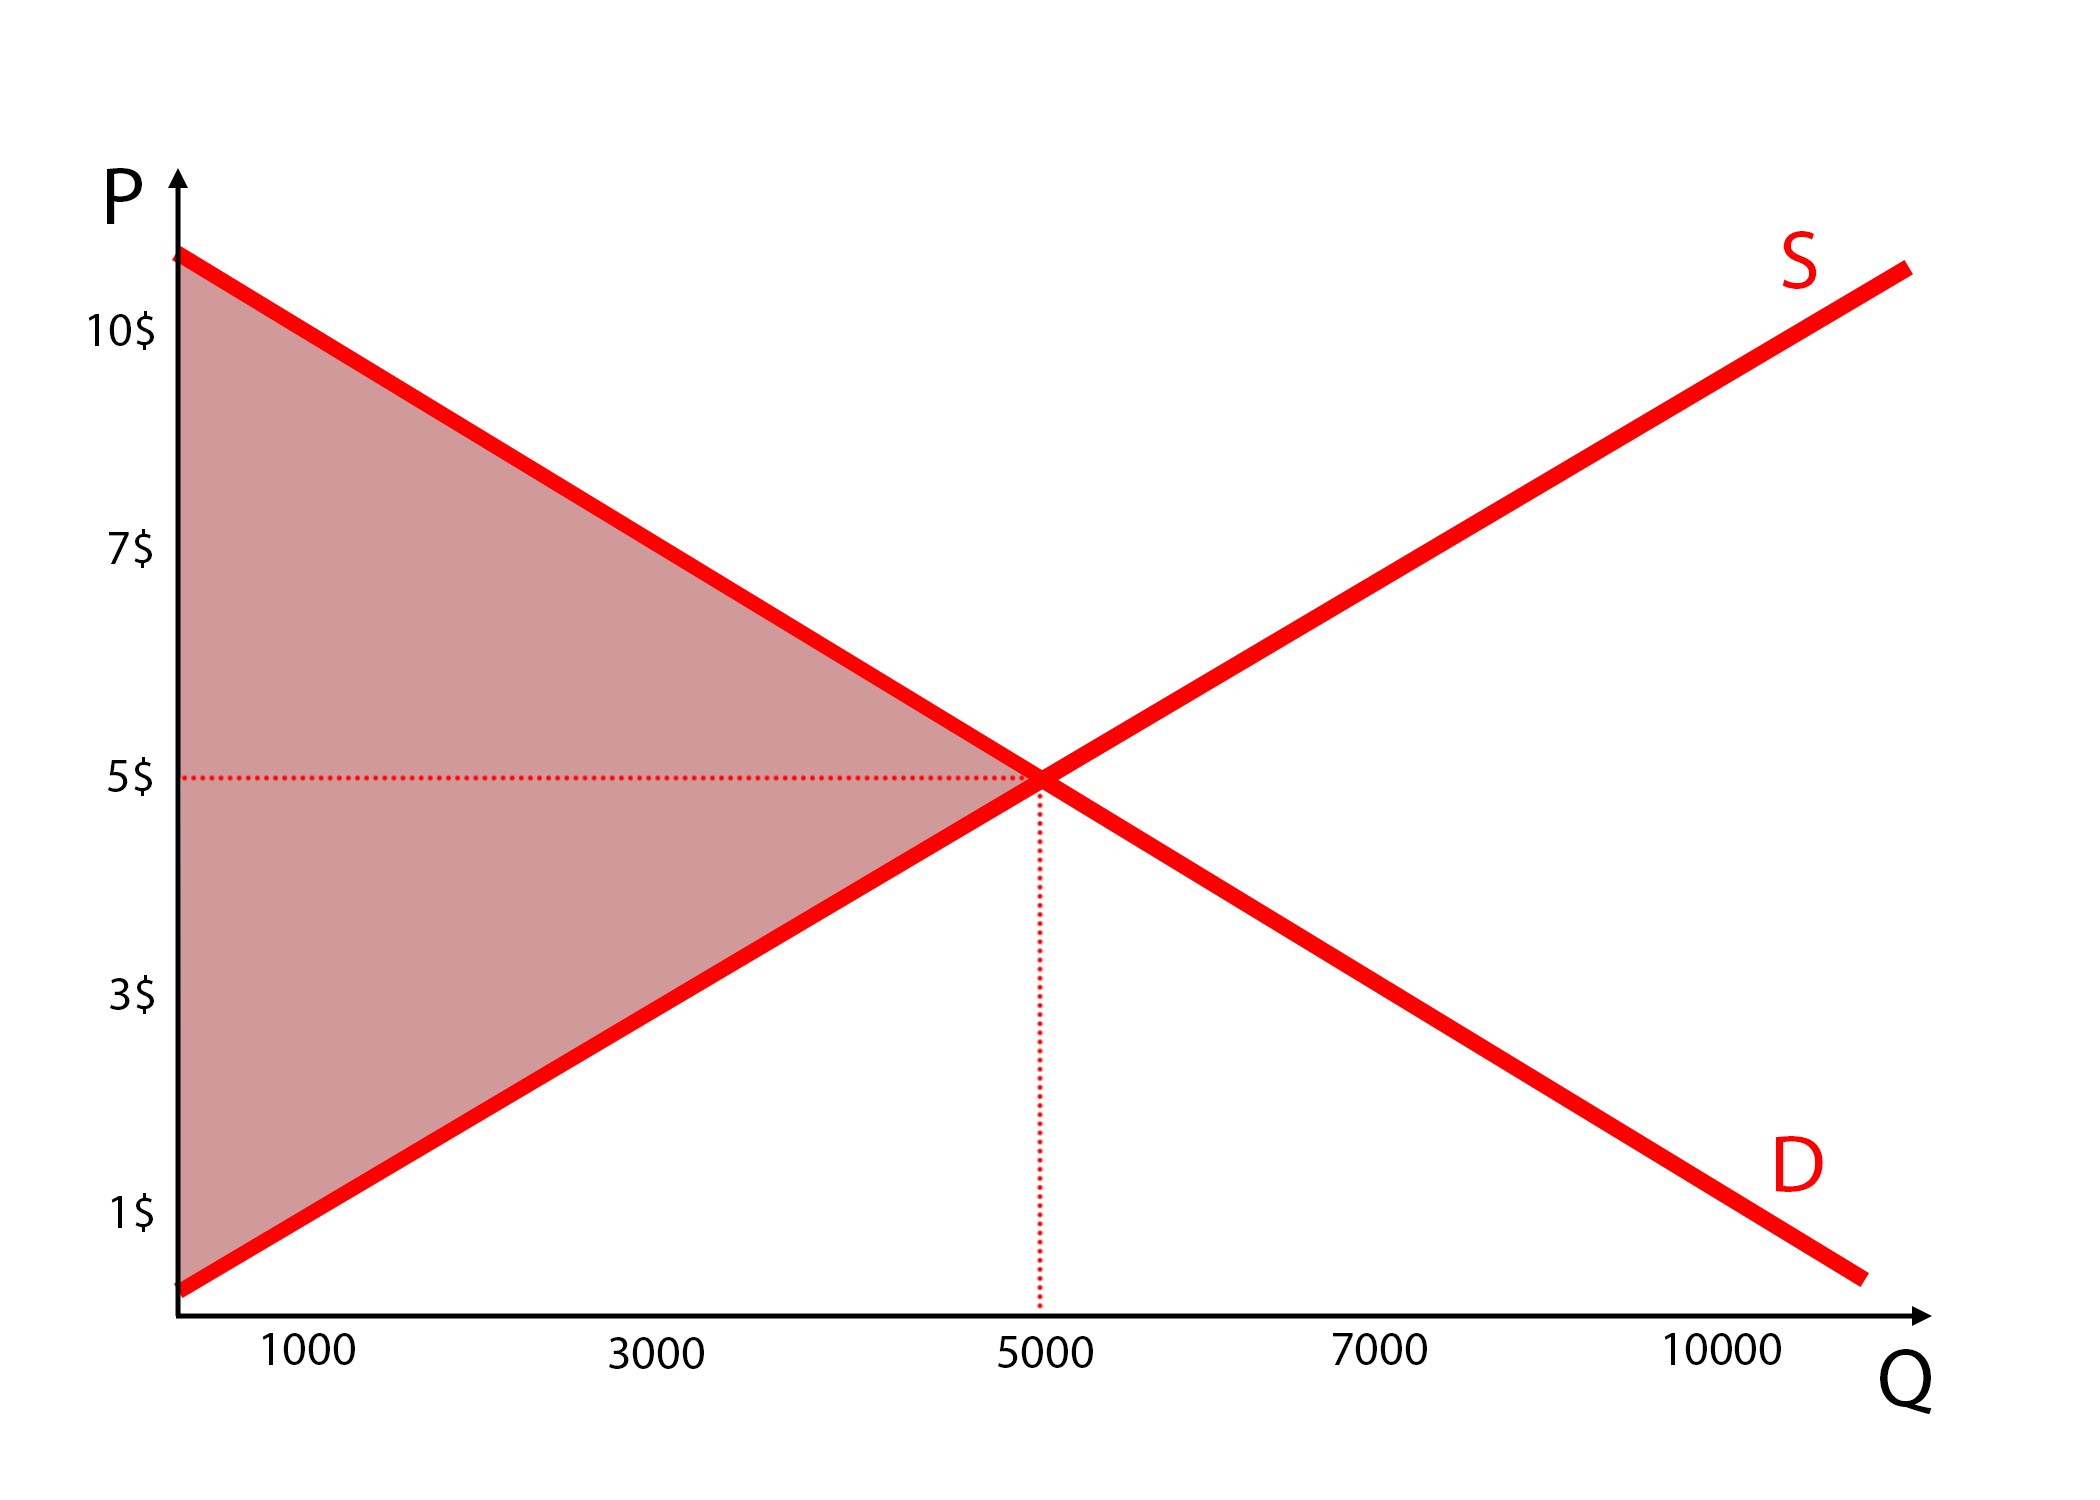
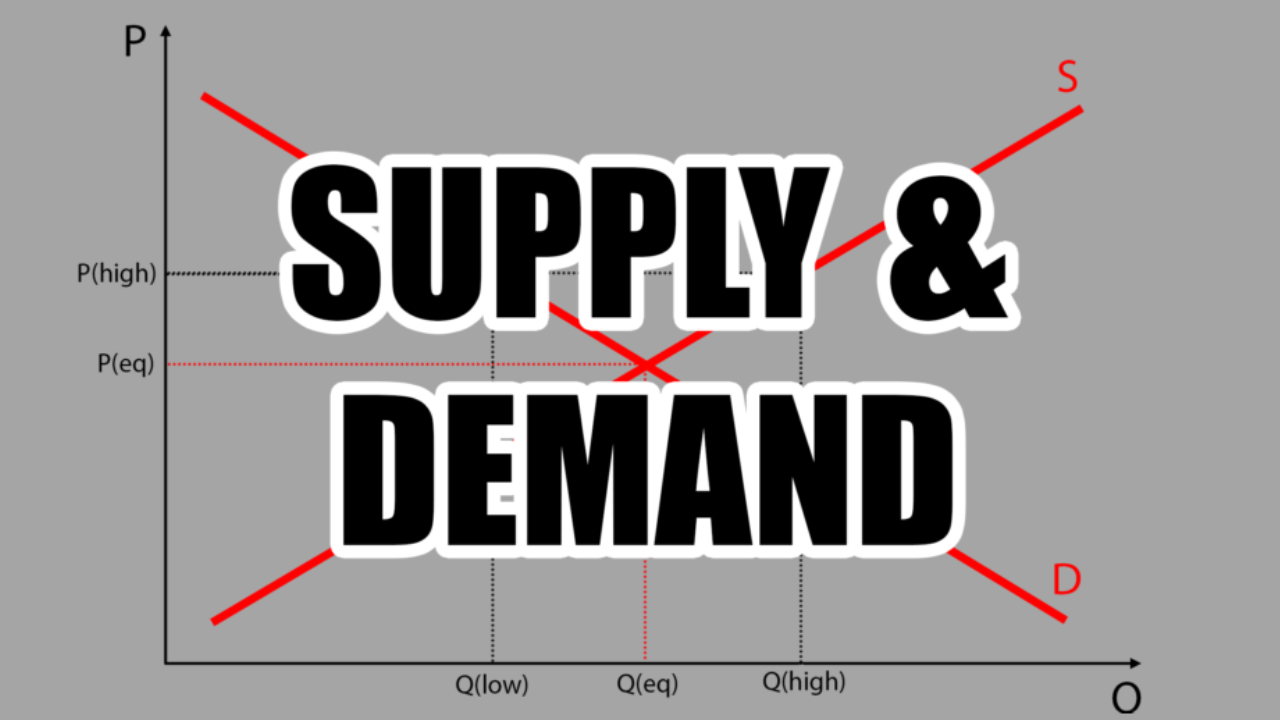
Here are the supply and demand curves for a certain good X.
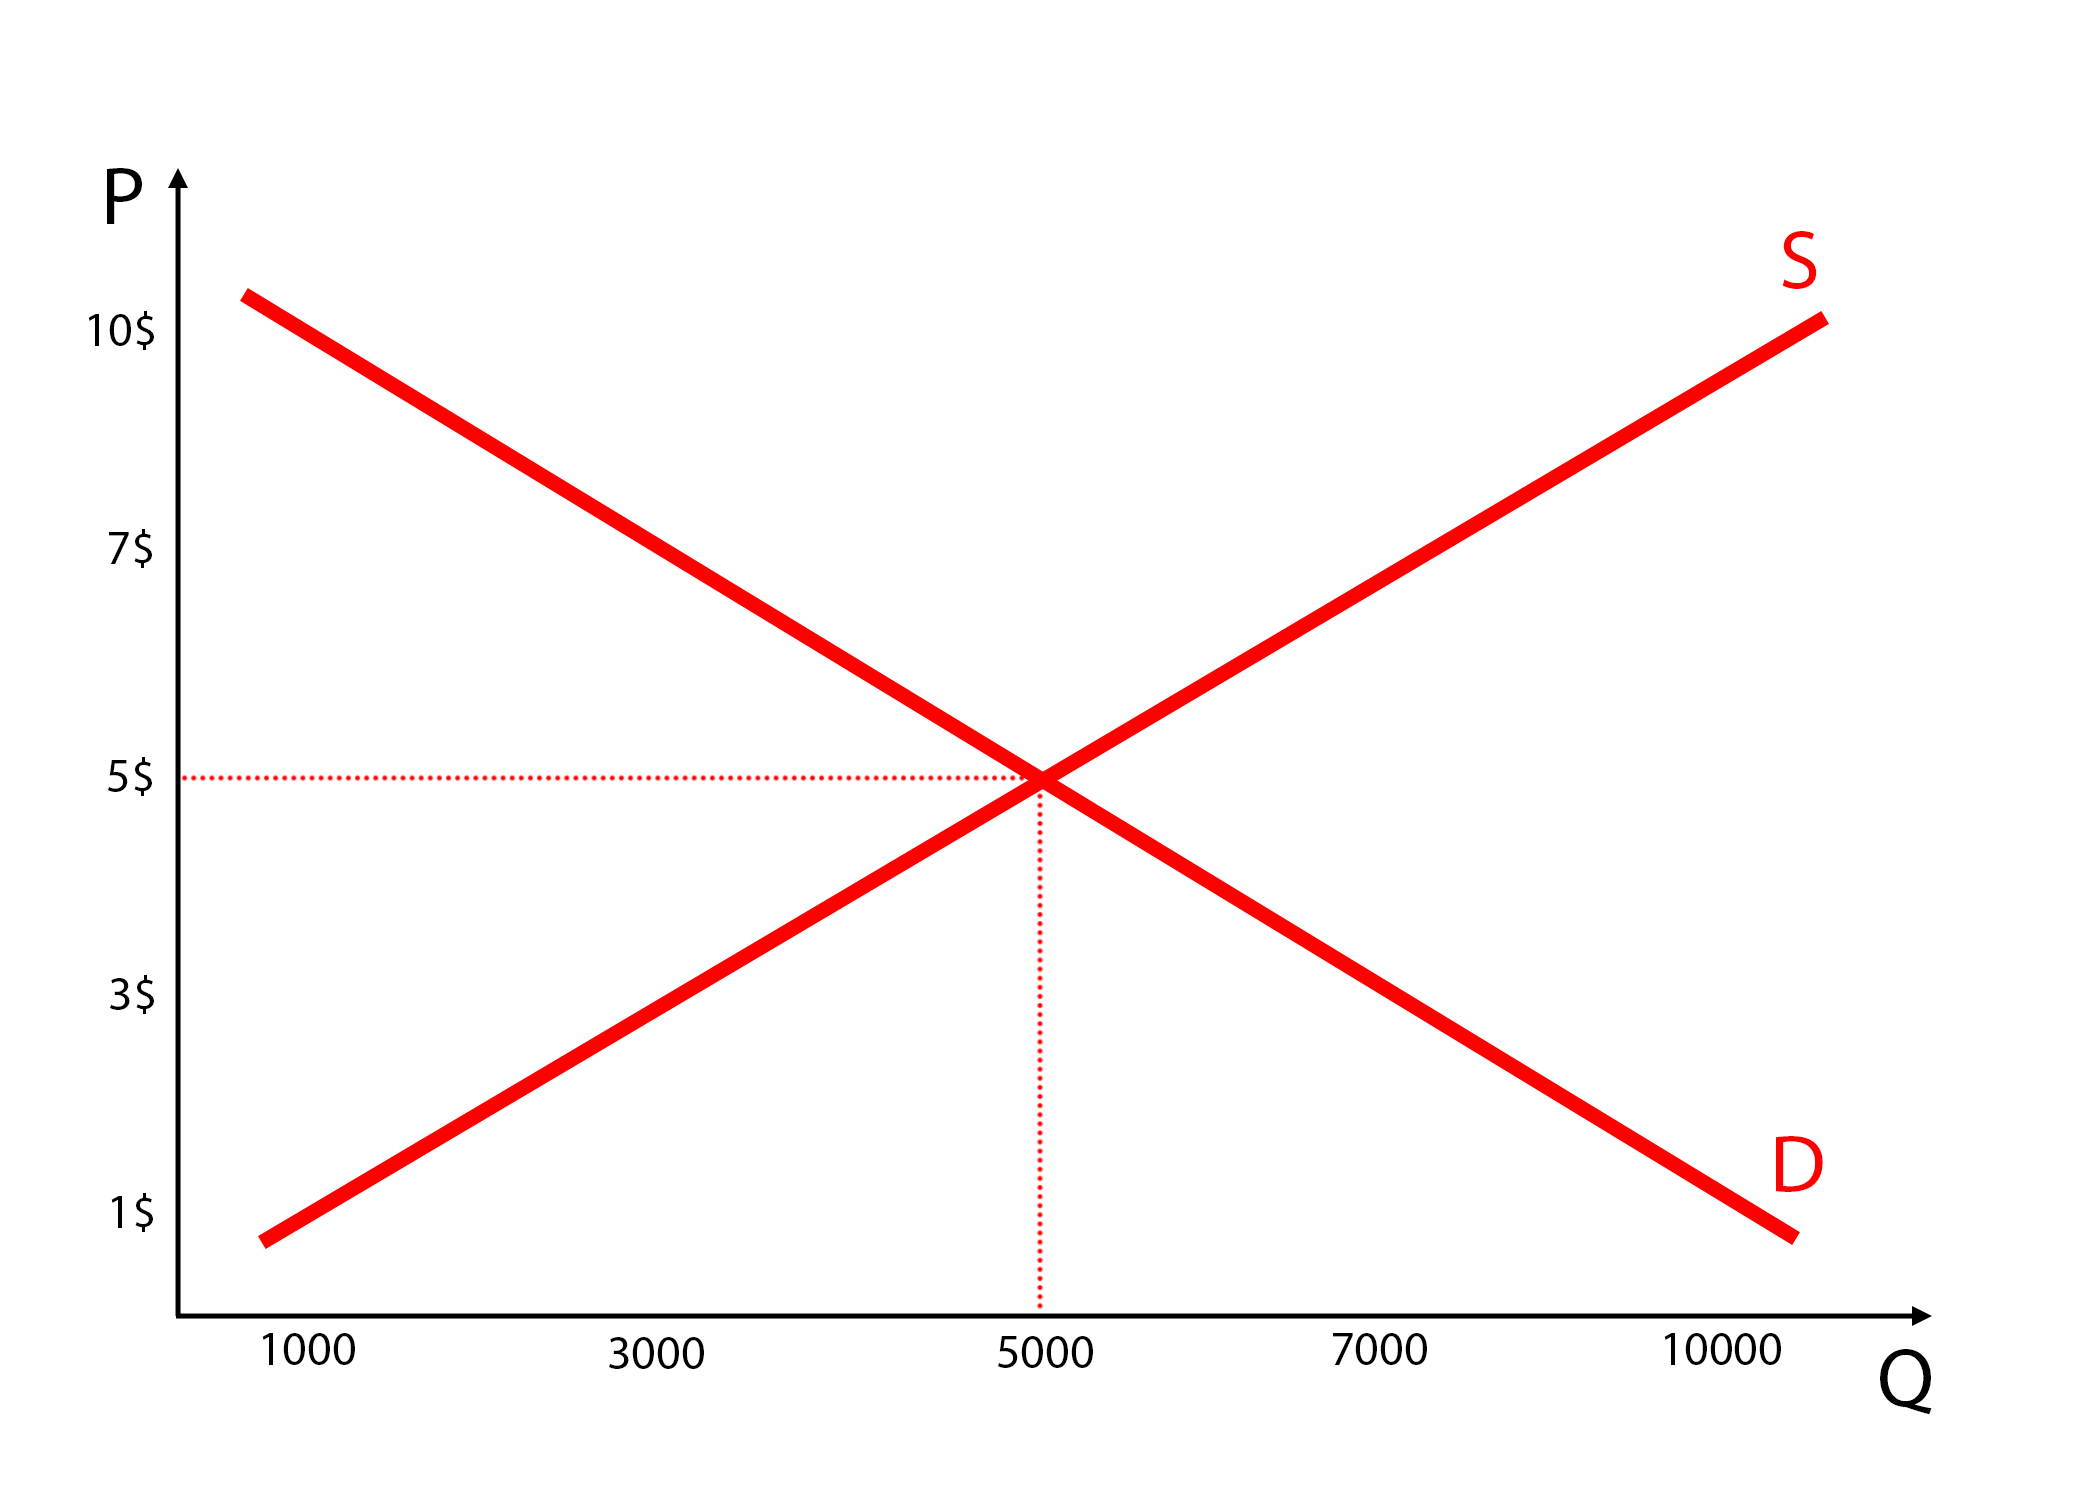
As we can see in the picture, the equilibrium price is $5 and the equilibrium quantity is 5,000.
However, if we take a look at the demand curve, we see that there is a portion of the population that are willing to buy the product even if it was $10. On the opposite side, there are consumers who’d buy larger quantities of the product, but only if it was $1.
This is the law of demand in action.
From the supply perspective, we see that some sellers would sell the product even if its price is $1, but in smaller quantities. On the other side, if the price of X was higher, there’d be much more supply.
This is the law of supply in action.
Consumer Surplus
Consumer surplus is the difference between the total value the consumers get out of the units of the good they buy and the total amount they need to pay to buy those units.
Long sentences can be confusing so let’s turn back to our example – buying X.
We know that there is someone out there who is willing to pay $10 to buy X. However, he bought the product for $5 – the price set by the market forces. The difference between the value that X has to him ($10) and the amount he paid to acquire it ($5) is the consumer surplus.
The grayed out area represents the total consumer surplus.
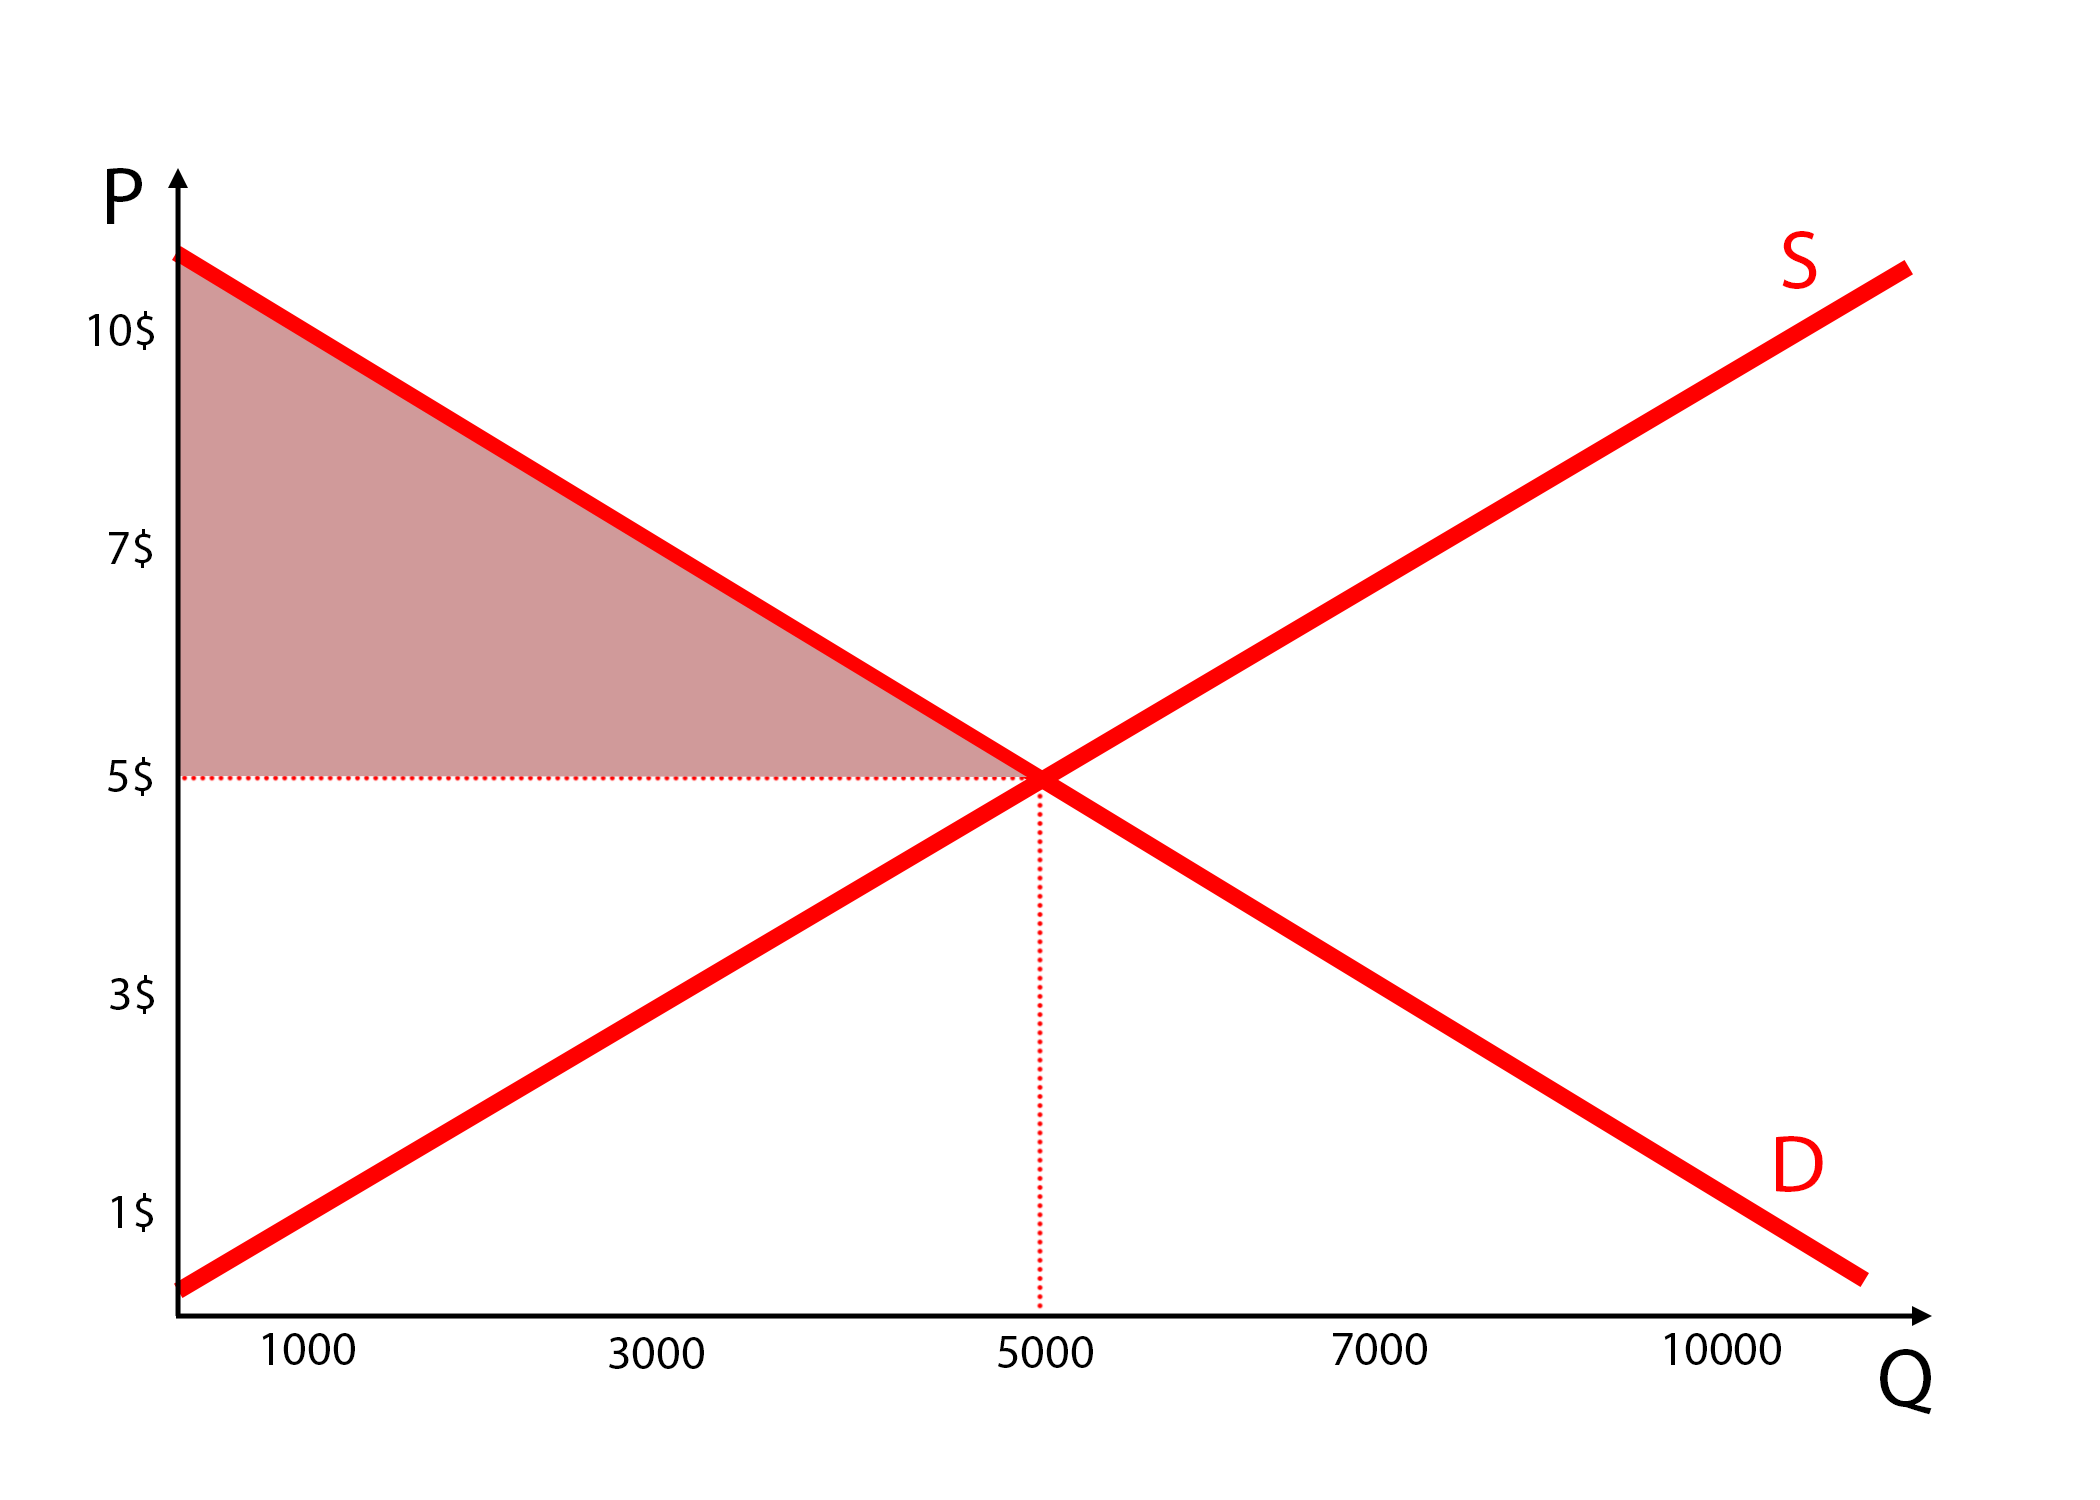
In simpler terms, it’s the surplus value a consumer gets relative to the purchase price.
Producer Surplus
Producer surplus is the difference between the total revenue (TR) suppliers earn by selling a certain number of units and the total variable cost (TVC) of producing those units.
Similarly to we did for the consumer surplus, let’s follow up with an example.
There are suppliers whose cost to sell is quite low and thus are willing to sell X for only $1. However, they’ll sell the product for $5 – the price set by the market forces. The difference between the selling price ($5) and the cost of selling (up to $1) is the producer surplus.
The grayed out area represents the total producer surplus.
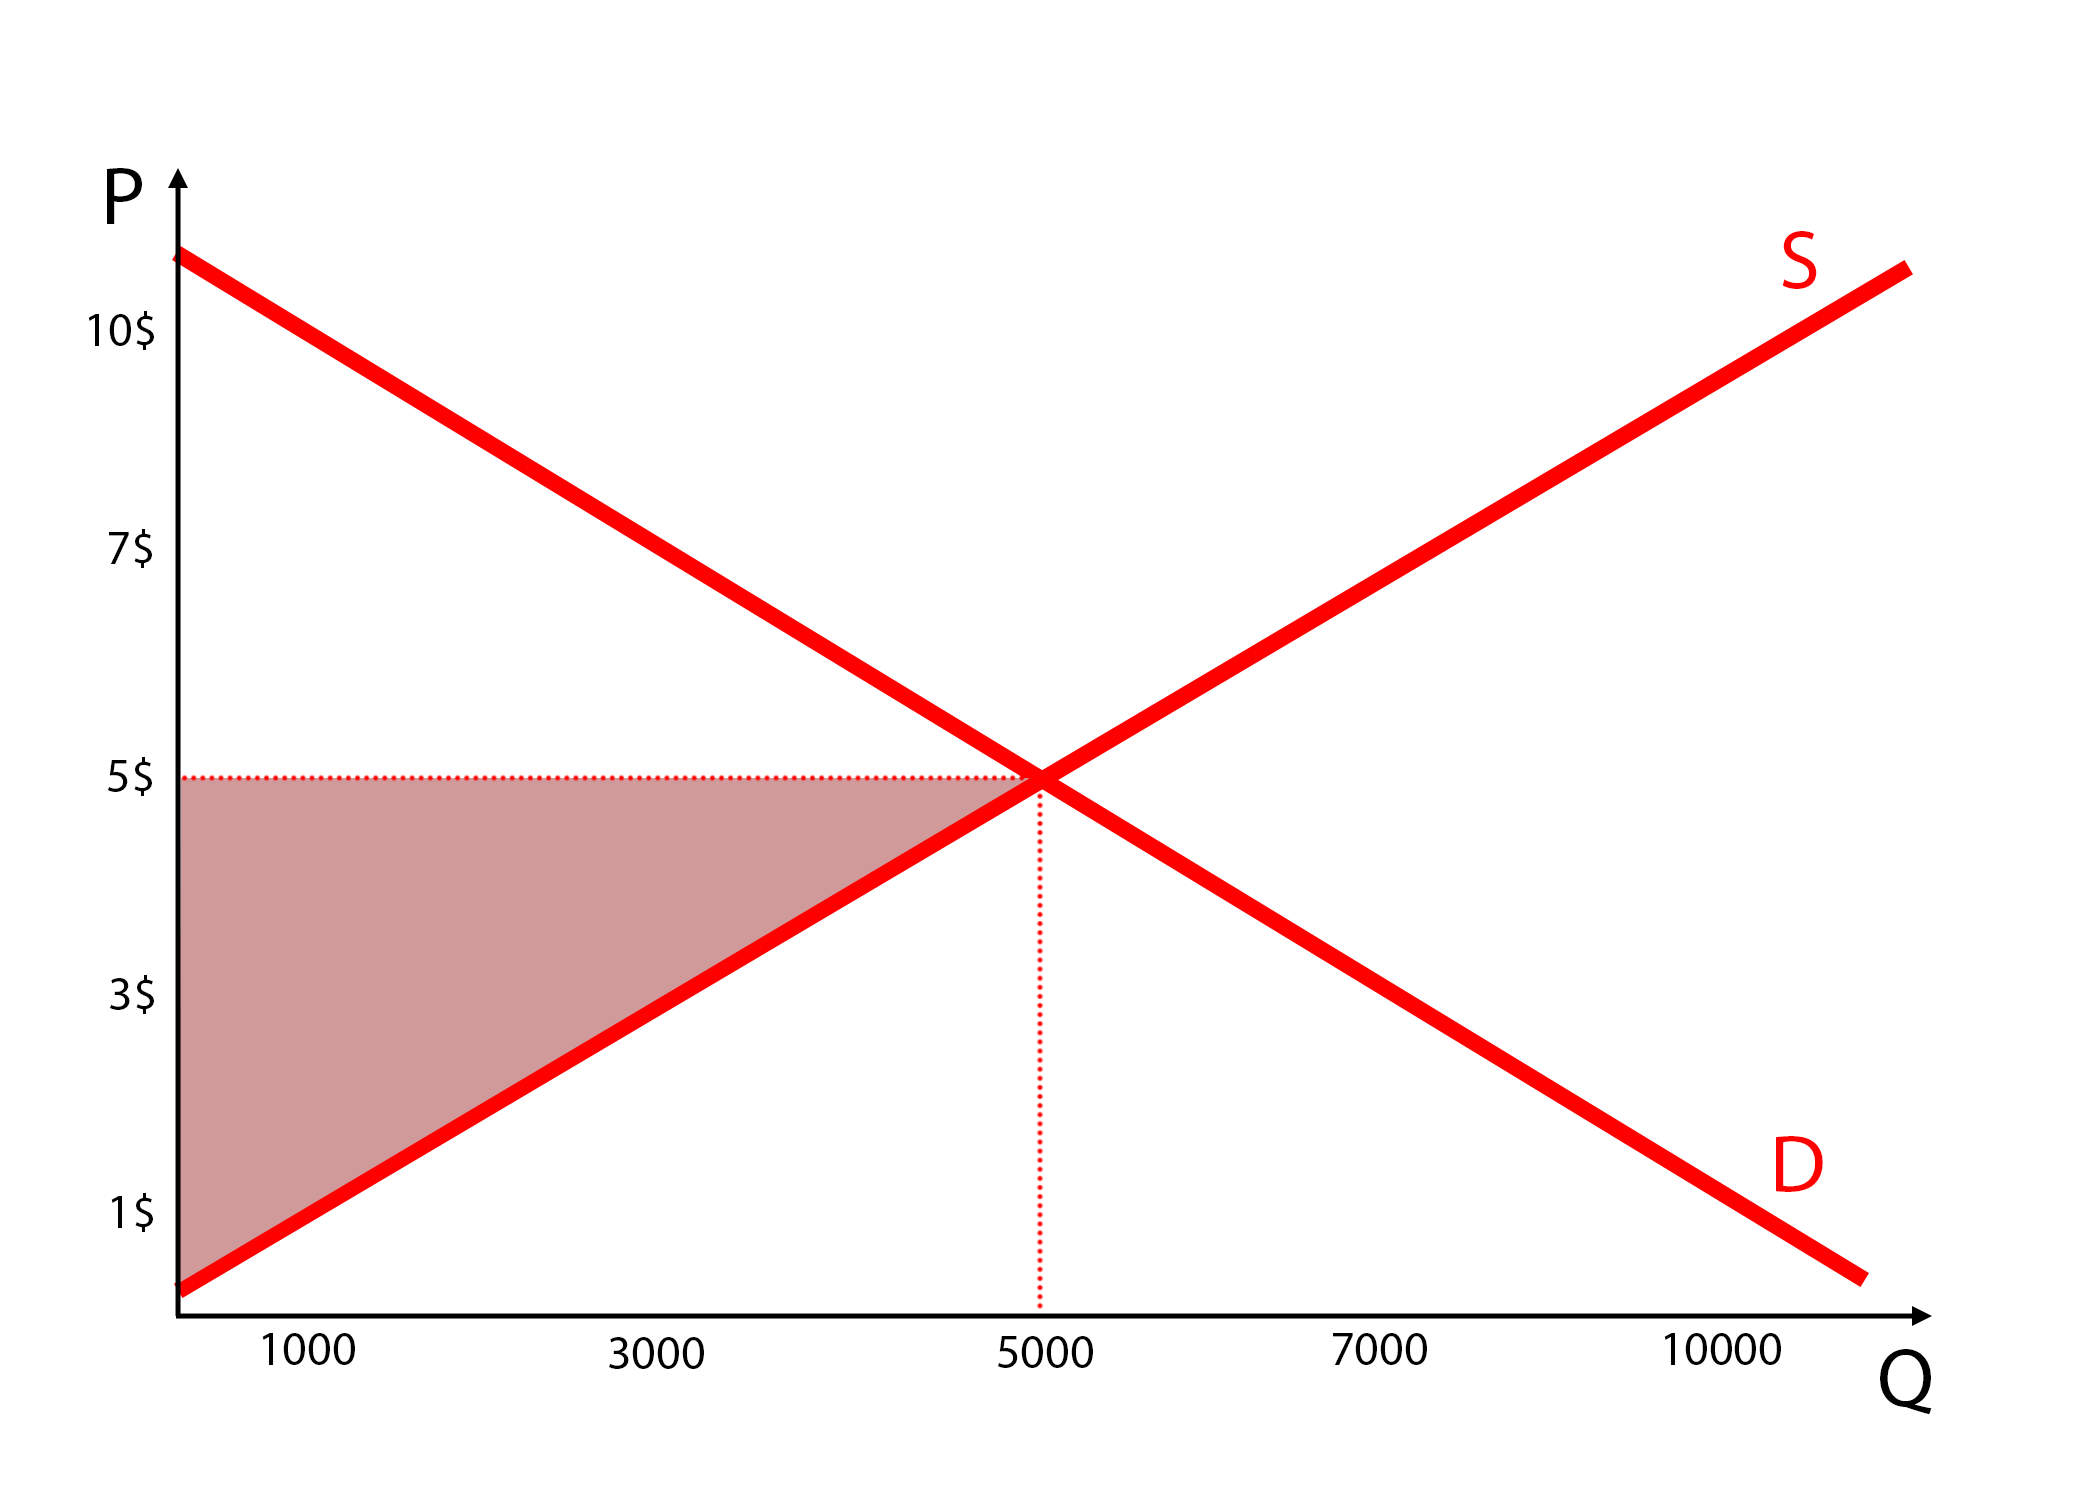
In simpler terms, it’s the surplus the producers get when selling a product for more than they value it.
Total Surplus and Benefit to Society
The combined amount of producer and consumer surplus is called the total surplus.
It’s shown in the grayed out area below.
The combination of consumers and producers trying to maximize the surplus leads to the efficient allocation of resources for X. It maximizes the total surplus from trading it.
In other words, it maximizes the total benefit to society.
Let’s understand why is that so.
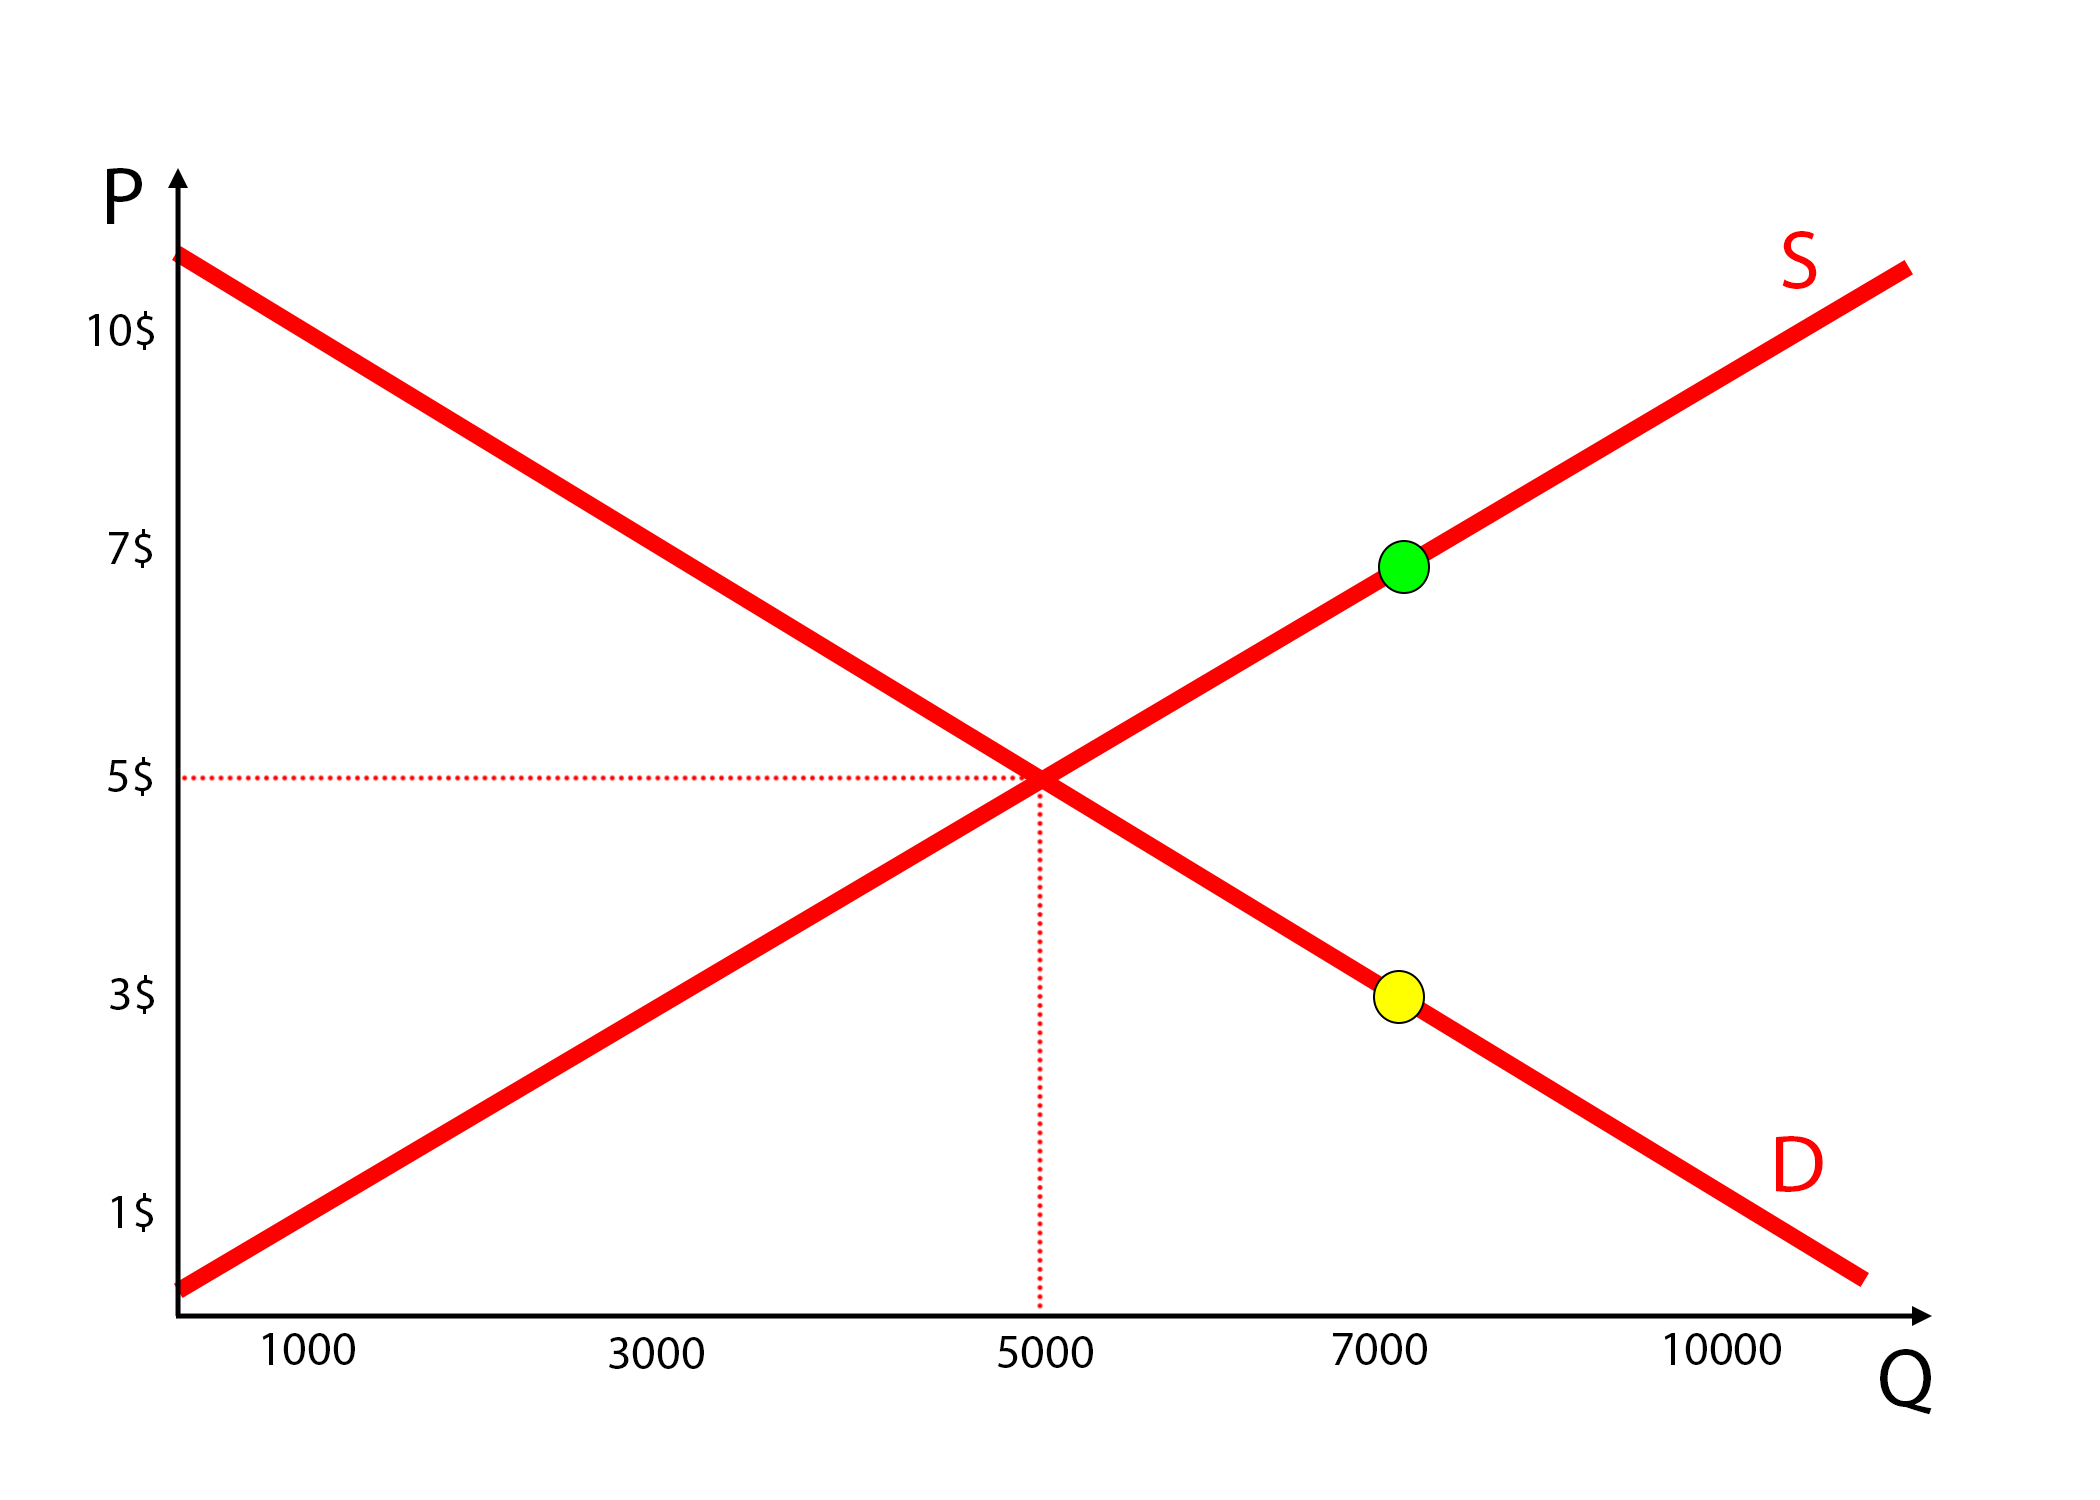
Look at the demand curve and see what happens with the consumer who is willing to buy X for a price of $3 (the yellow dot).
Nothing happens.
This consumer doesn’t value X enough in order to purchase it for $5 – the price set by the market.
Now, let’s see what happens with suppliers that have high TVC of creating X. For example, someone who’s willing to sell the product for $7 (the green dot).
Have a guess.
Exactly – nothing happens as well.
Their cost of producing X is so high that they can’t afford to sell it at the market price of $5 and thus they’re not participating in the market.
The total surplus will be maximized when the resources used for producing X satisfy most of the society. This is achieved by maximizing total surplus.
Deadweight Loss
Deadweight loss is the reduction in consumer surplus and producer surplus due to overproduction and underproduction.
Don’t worry if it sounds confusing, as the examples usually have you covered.
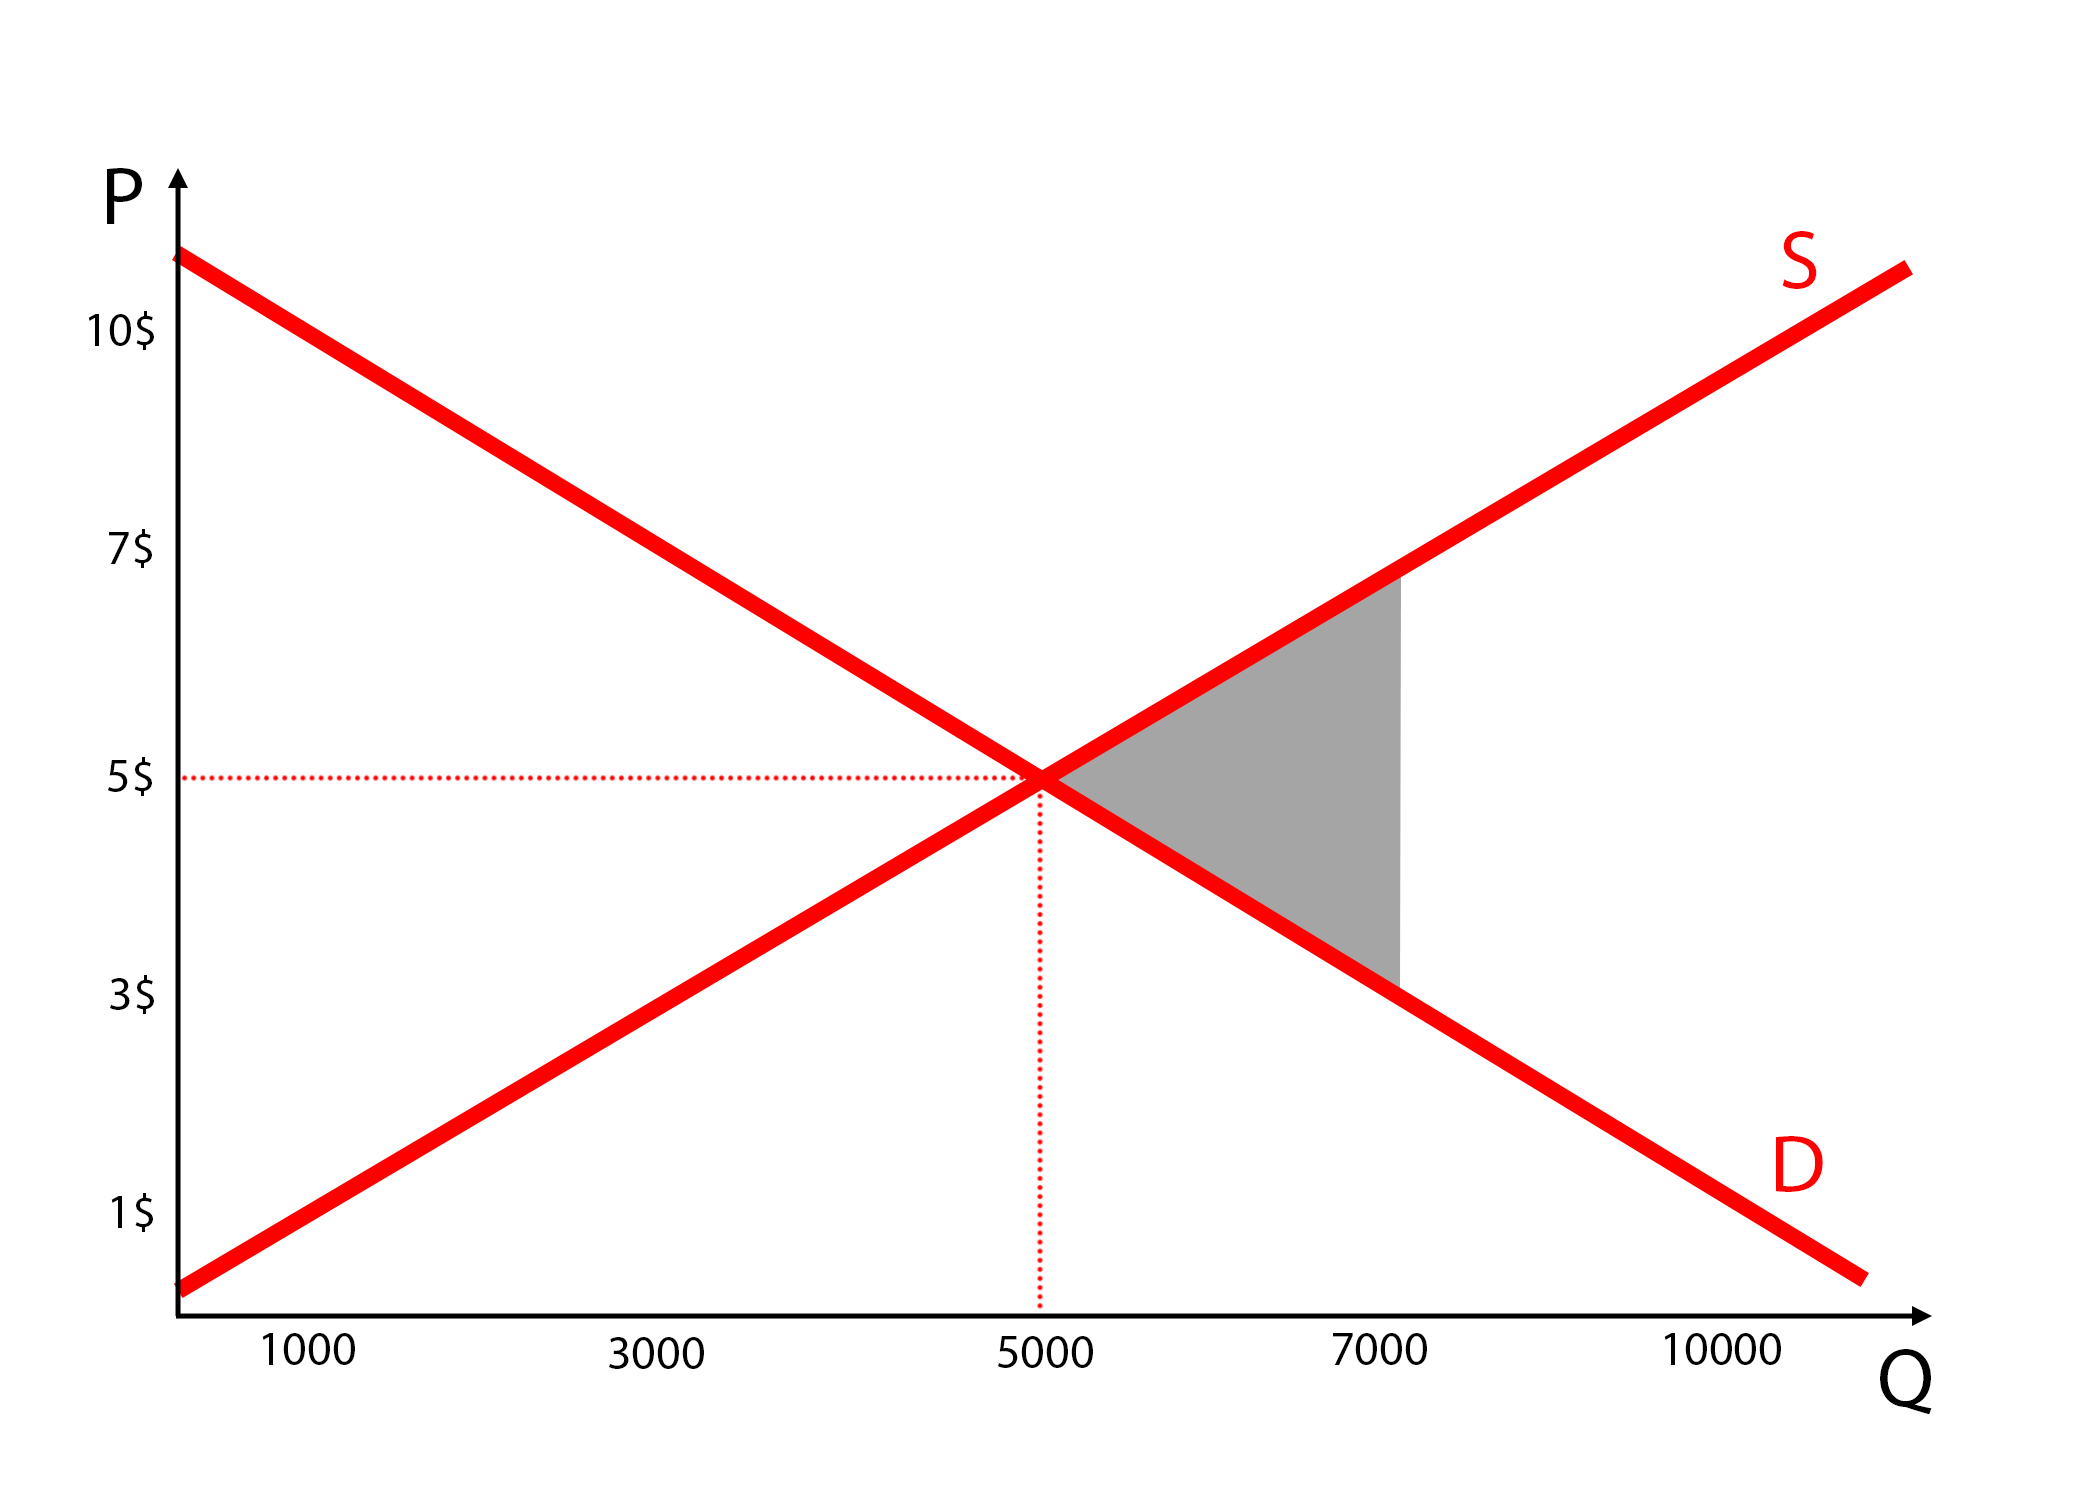
If producers decide to produce 7,000 units of X and sell them for $7, there won’t be enough consumers willing to pay that price for the product.
The deadweight loss created due to overproduction is the grayed out area in the picture below.
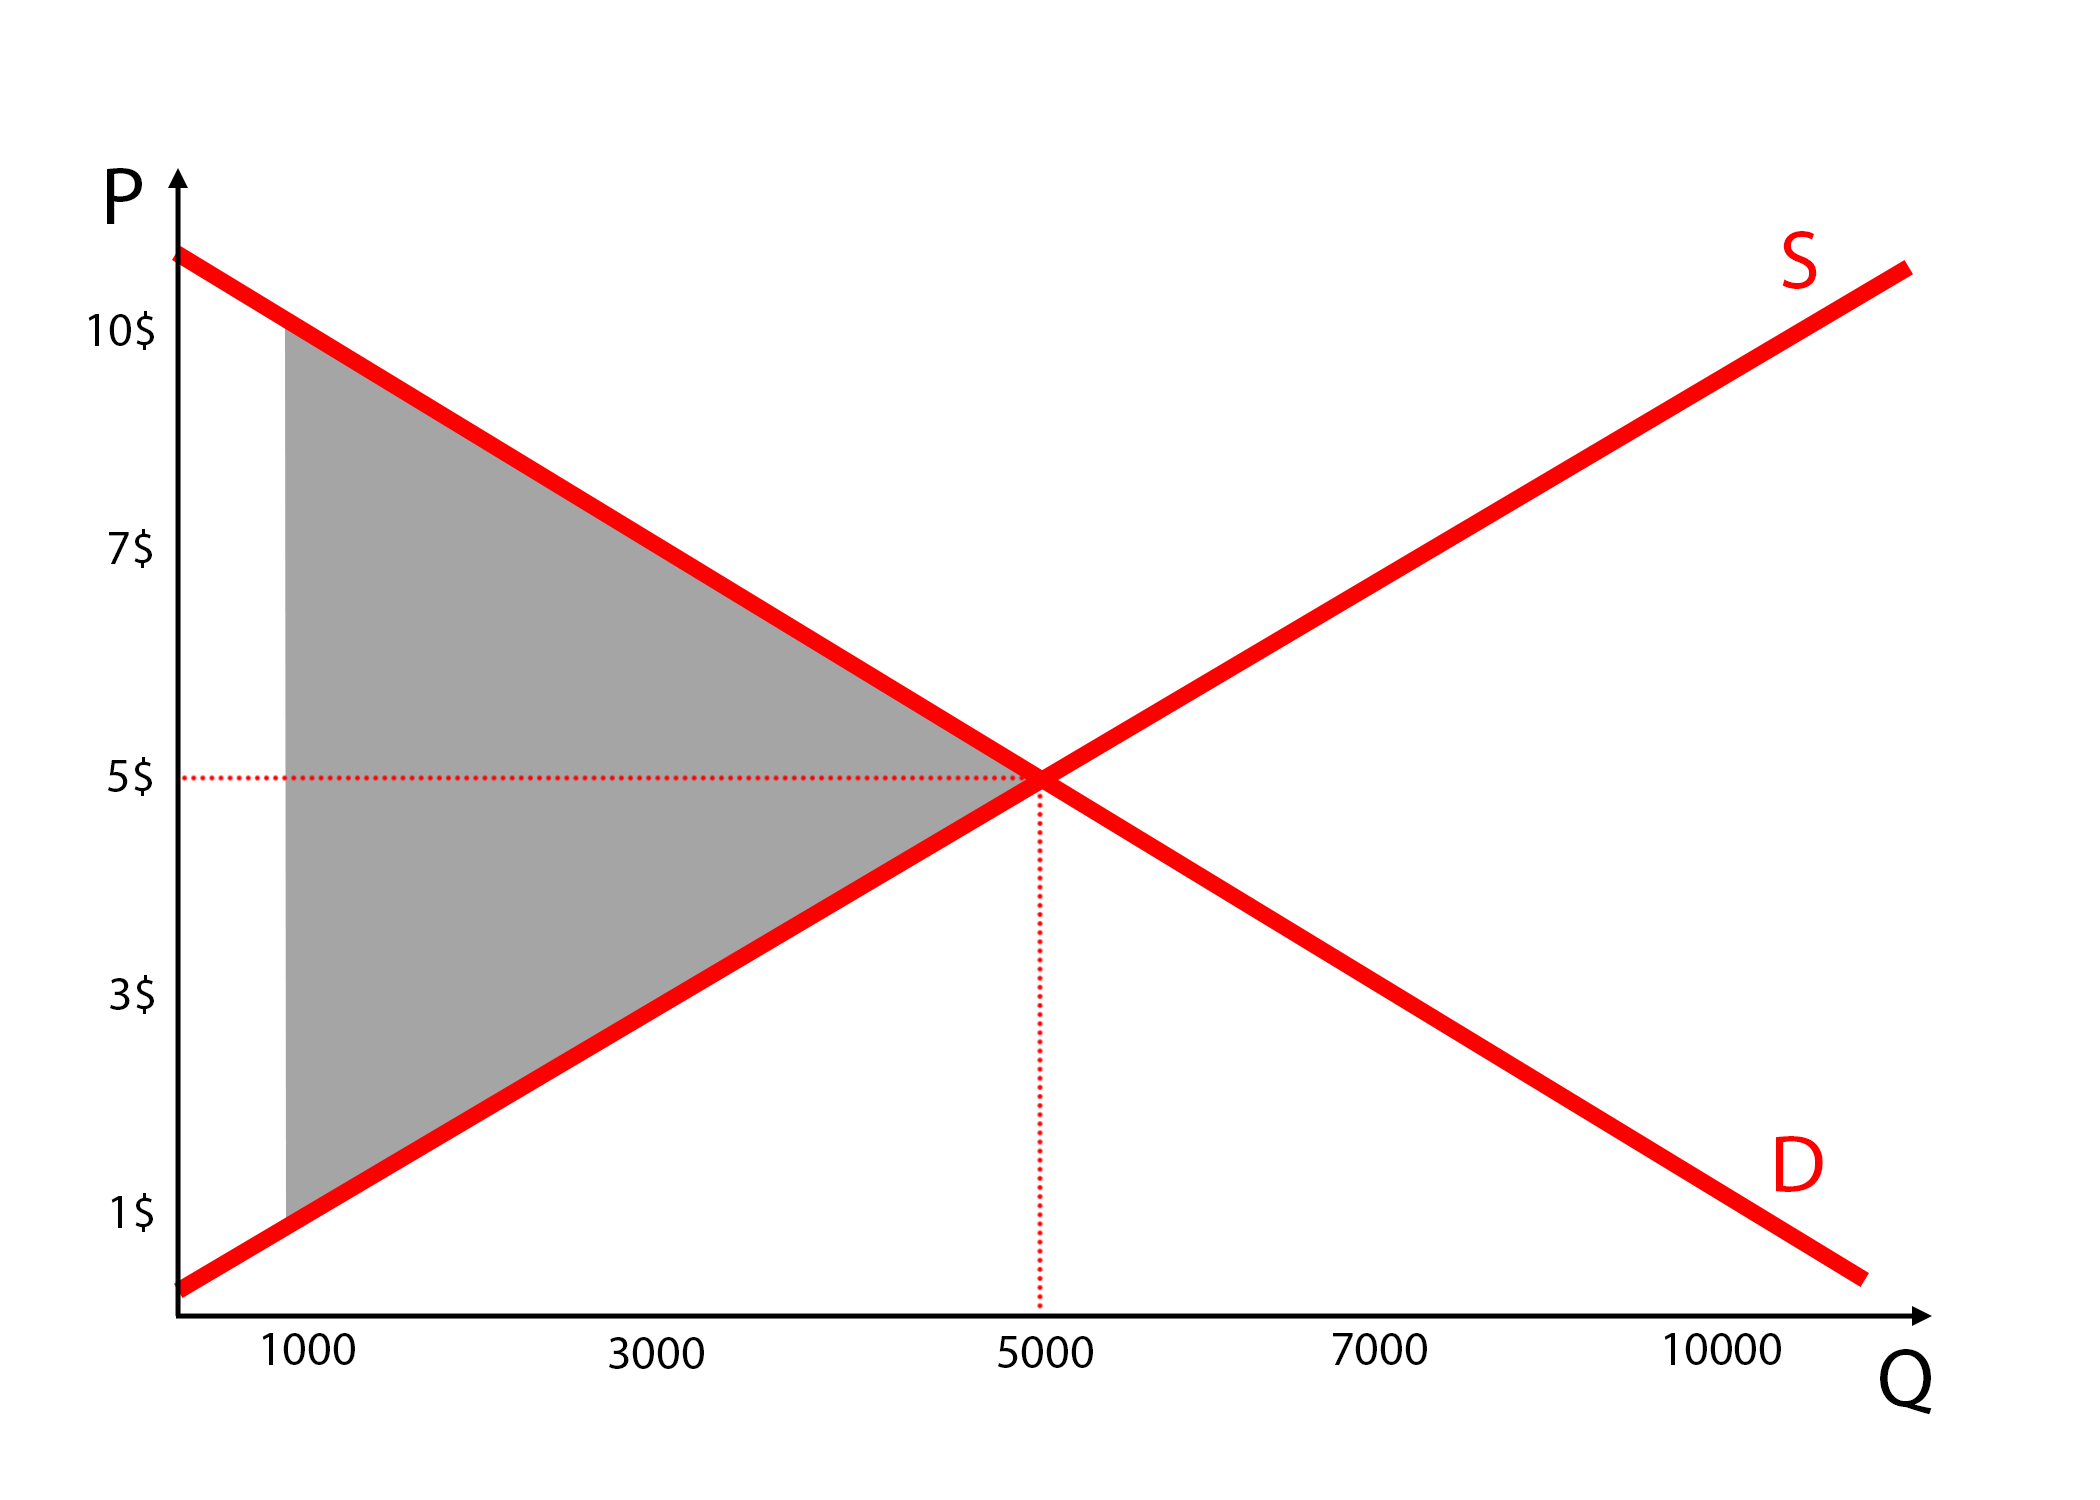
On the other hand, if producers produce only 1,000 units of X, there will be a larger portion of the population which would happily pay more but won’t get the product, and also the revenue won’t be maximized.
The deadweight loss created due to underproduction is the grayed out area in the picture below.
If we generalize a bit, we can see that both overproduction and underproduction lead to inefficient allocation of resources that doesn’t maximize consumer and producer surplus and thus the benefit of society.
And, as explained in the supply and demand post before, any deviation will be pushed back to the equilibrium by the market forces. If there is shortage in the market, more suppliers will join to profit from the existing demand, bringing the price and quantity supplied and consumed to equilibrium. If they eventually overproduce, less consumers will be willing to buy at a high price, so the sellers will be forced to decrease the supply, again, ending at equilibrium.
The markets are amazing and also efficient in allocating resources and setting the price.
What Threatens the Free Market?
This is how beautiful the free market can be.
The prices are set by the market participants themselves. Every participant votes with their money and prices quickly converge to maximize the benefit to society.
But then…
There is the government.
Imposing taxes, quotas, price ceilings… And it all becomes inefficient.
I’ll explain how government interference makes everything less efficient in the next Supply & Demand post – Obstacles to Efficiency.
Author
-

D. Petkovski
📓 The Author Husband & Father
Software Engineer StrengthCentric
 ₿itcoin Hodler Long-Term Investor
🌍 Everything Enthusiast 🔥 Optimist
 Husband & Father
  Software Engineer

Related posts:
 Liquidity Provision (LP) and Impermanent Loss (IL) Explained
 Supply and Demand – An Introduction
 Investment Taxes in ALL EU Countries (2024)
 Bitcoin Tax in All EU Countries (Capital Gains & Wealth Taxes) (2024)
 Taxes for Dummies – How Tax Works?
 I Didn’t Get Lucky – The Opportunity in Bitcoin
 Opportunity Cost With a Twist
 Net-Worth Taxation in Europe (EU Wealth Taxes) (2024)
 Yield Conversion – HPY, EAY, BDY, MMY, BEY (Convert Easily)
 Inflation Explained
 Market Cap vs Fully Diluted Valuation (FDV) – Explanation & Practical Analysis
 Receive Tax Free Dividends in The Netherlands
 Can Bitcoin Reach One Million Dollars?
 Exit Into What? The Curious Case of Bitcoin
 Not Everything is a Short Squeeze