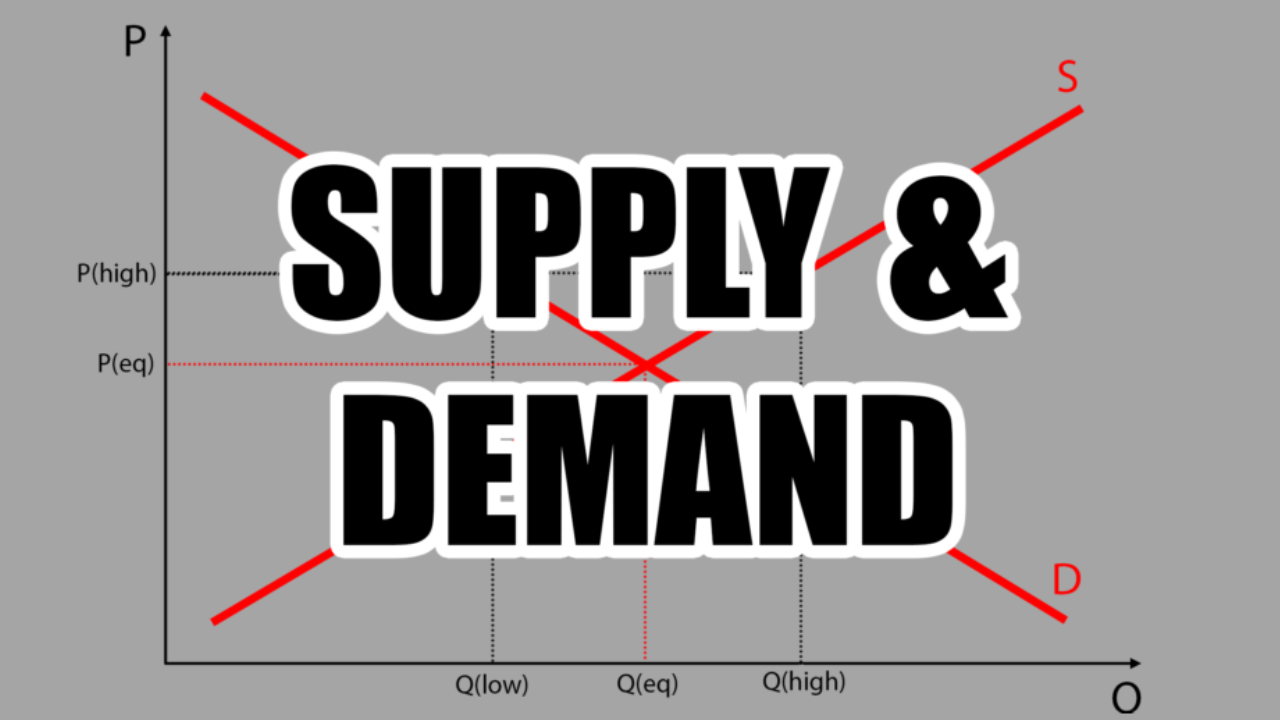
The law of supply and demand is something that’s often referenced, but rarely understood.
Even people with formal education in economics that can explain how it affected certain situations in the past can’t really apply the knowledge to forecast the future.
In other words: this post can make you psychic, practically.
Enjoy this gentle introduction to buy and sell pressure when determining the price of anything.
Demand Curve
Demand refers to the quantity of a good that consumers are both willing and able to buy at various prices.
The demand of goods is not only a function of that good’s price, but other factors as well. These include: income, price of substitute goods, and price of complementary goods.
For example, an individual’s demand for a brand new phone case will be a function of its price, the person’s income, the price of the alternative cases (substitute goods), and the price of the mobile phones (complementary goods).
Let’s analyze the relationships between each.
- The demand increases as the substitute goods’ prices increase. A consumer won’t buy the most expensive item if the alternatives are cheaper.
- The demand increases as the complementary goods’ prices decrease. If the price for all phones skyrocket, less people will need phone cases.
- The demand increases as the income of the consumer increases, as he can afford a higher quantity of the good.
- The demand increases as the price of a good decreases. This relationship is what we’ll focus on:
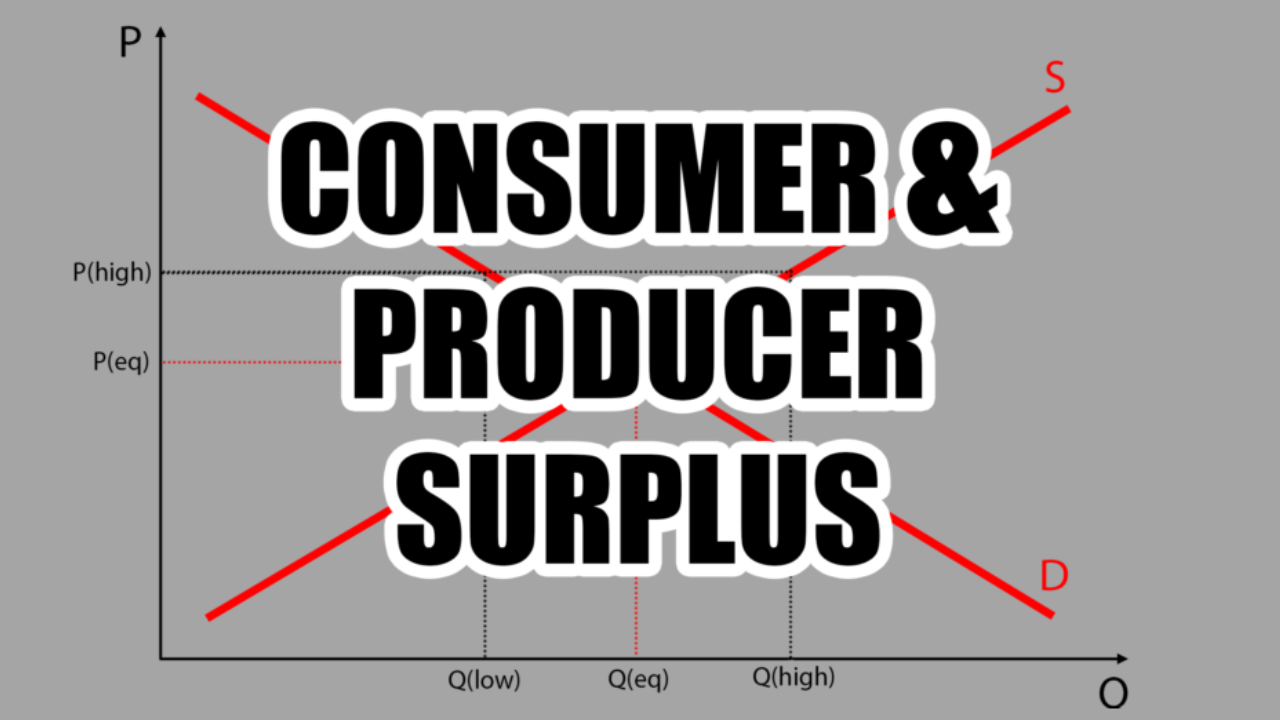
This is called the demand curve and is illustrated in the picture below.
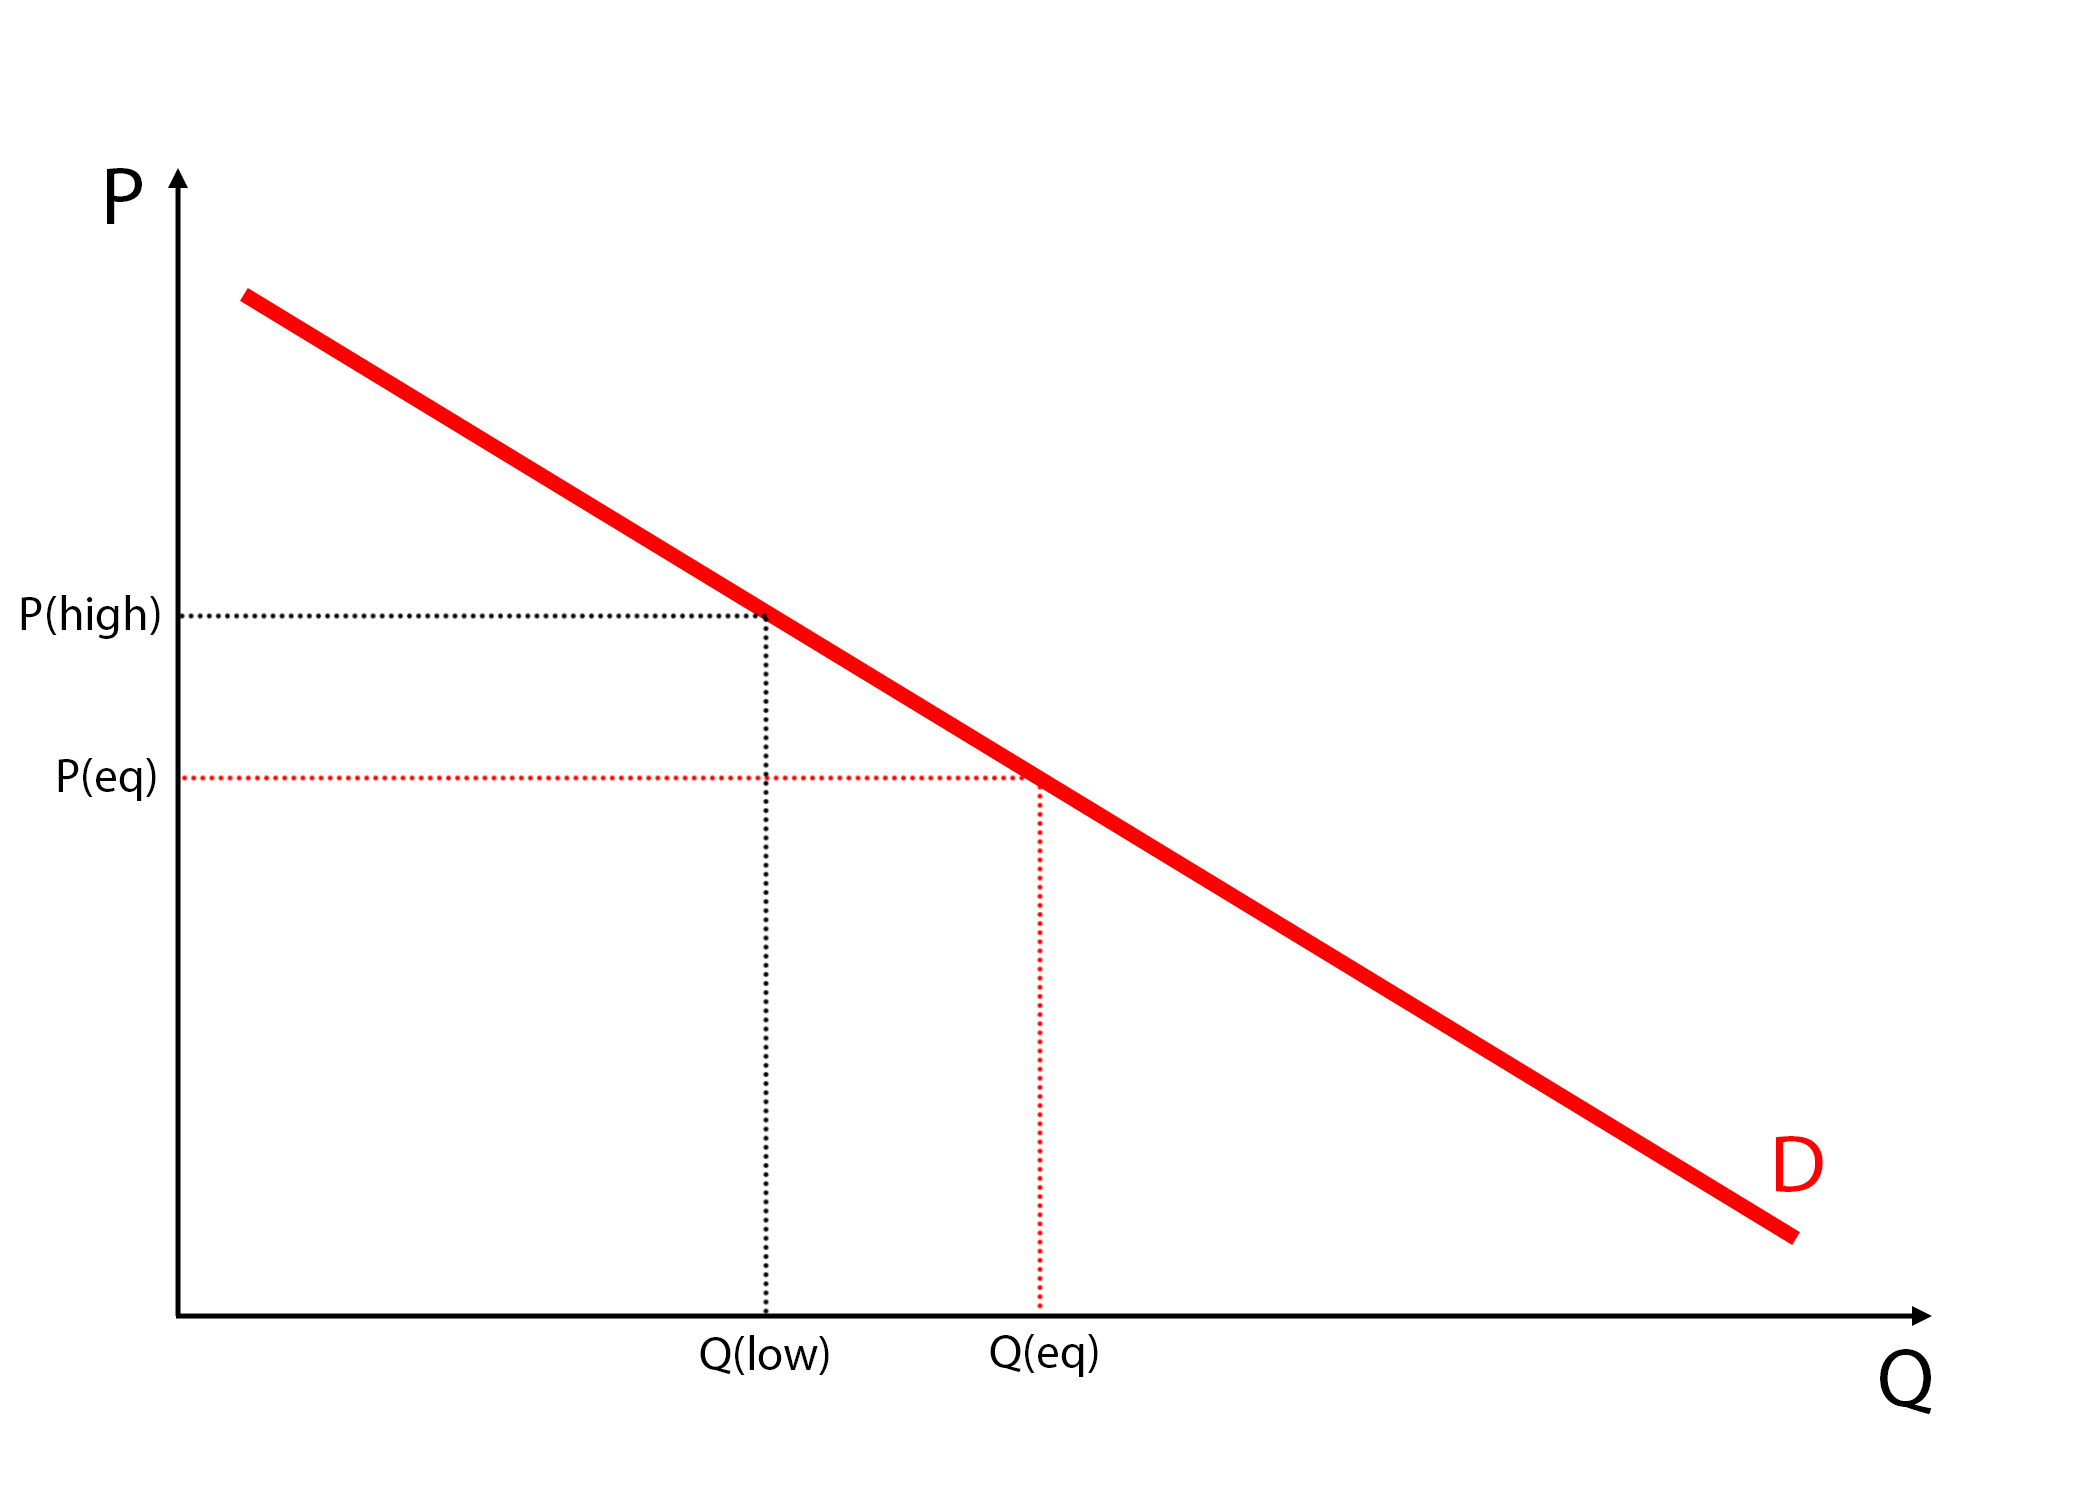
P = Price, Q = Quantity
The fact that the demand is higher at lower prices is referred to as the law of demand.
Note how a change in price from P(eq) to P(high) changes the quantity demanded to Q(low) in response.
In other words: as prices increase the demand decreases and as prices decrease the demand increases.
Supply Curve
Supply refers to the quantity of a good that producers are both willing and able to sell at various prices.
The supply of a good is also not only a function of the selling price, but of the costs of production and selling as well.
For example, a manufacturer’s supply of phone cases will depend on its selling price, but also on the cost of labor, cose of the materials, rent prices, etc.
- The supply decreases with increasing business expenses. If it’s too expensive to sell, it may not be worth it anymore.
- The supply increases with selling price. Sellers would always chase a greater margin.
This is called the supply curve and is illustrated in the picture below.
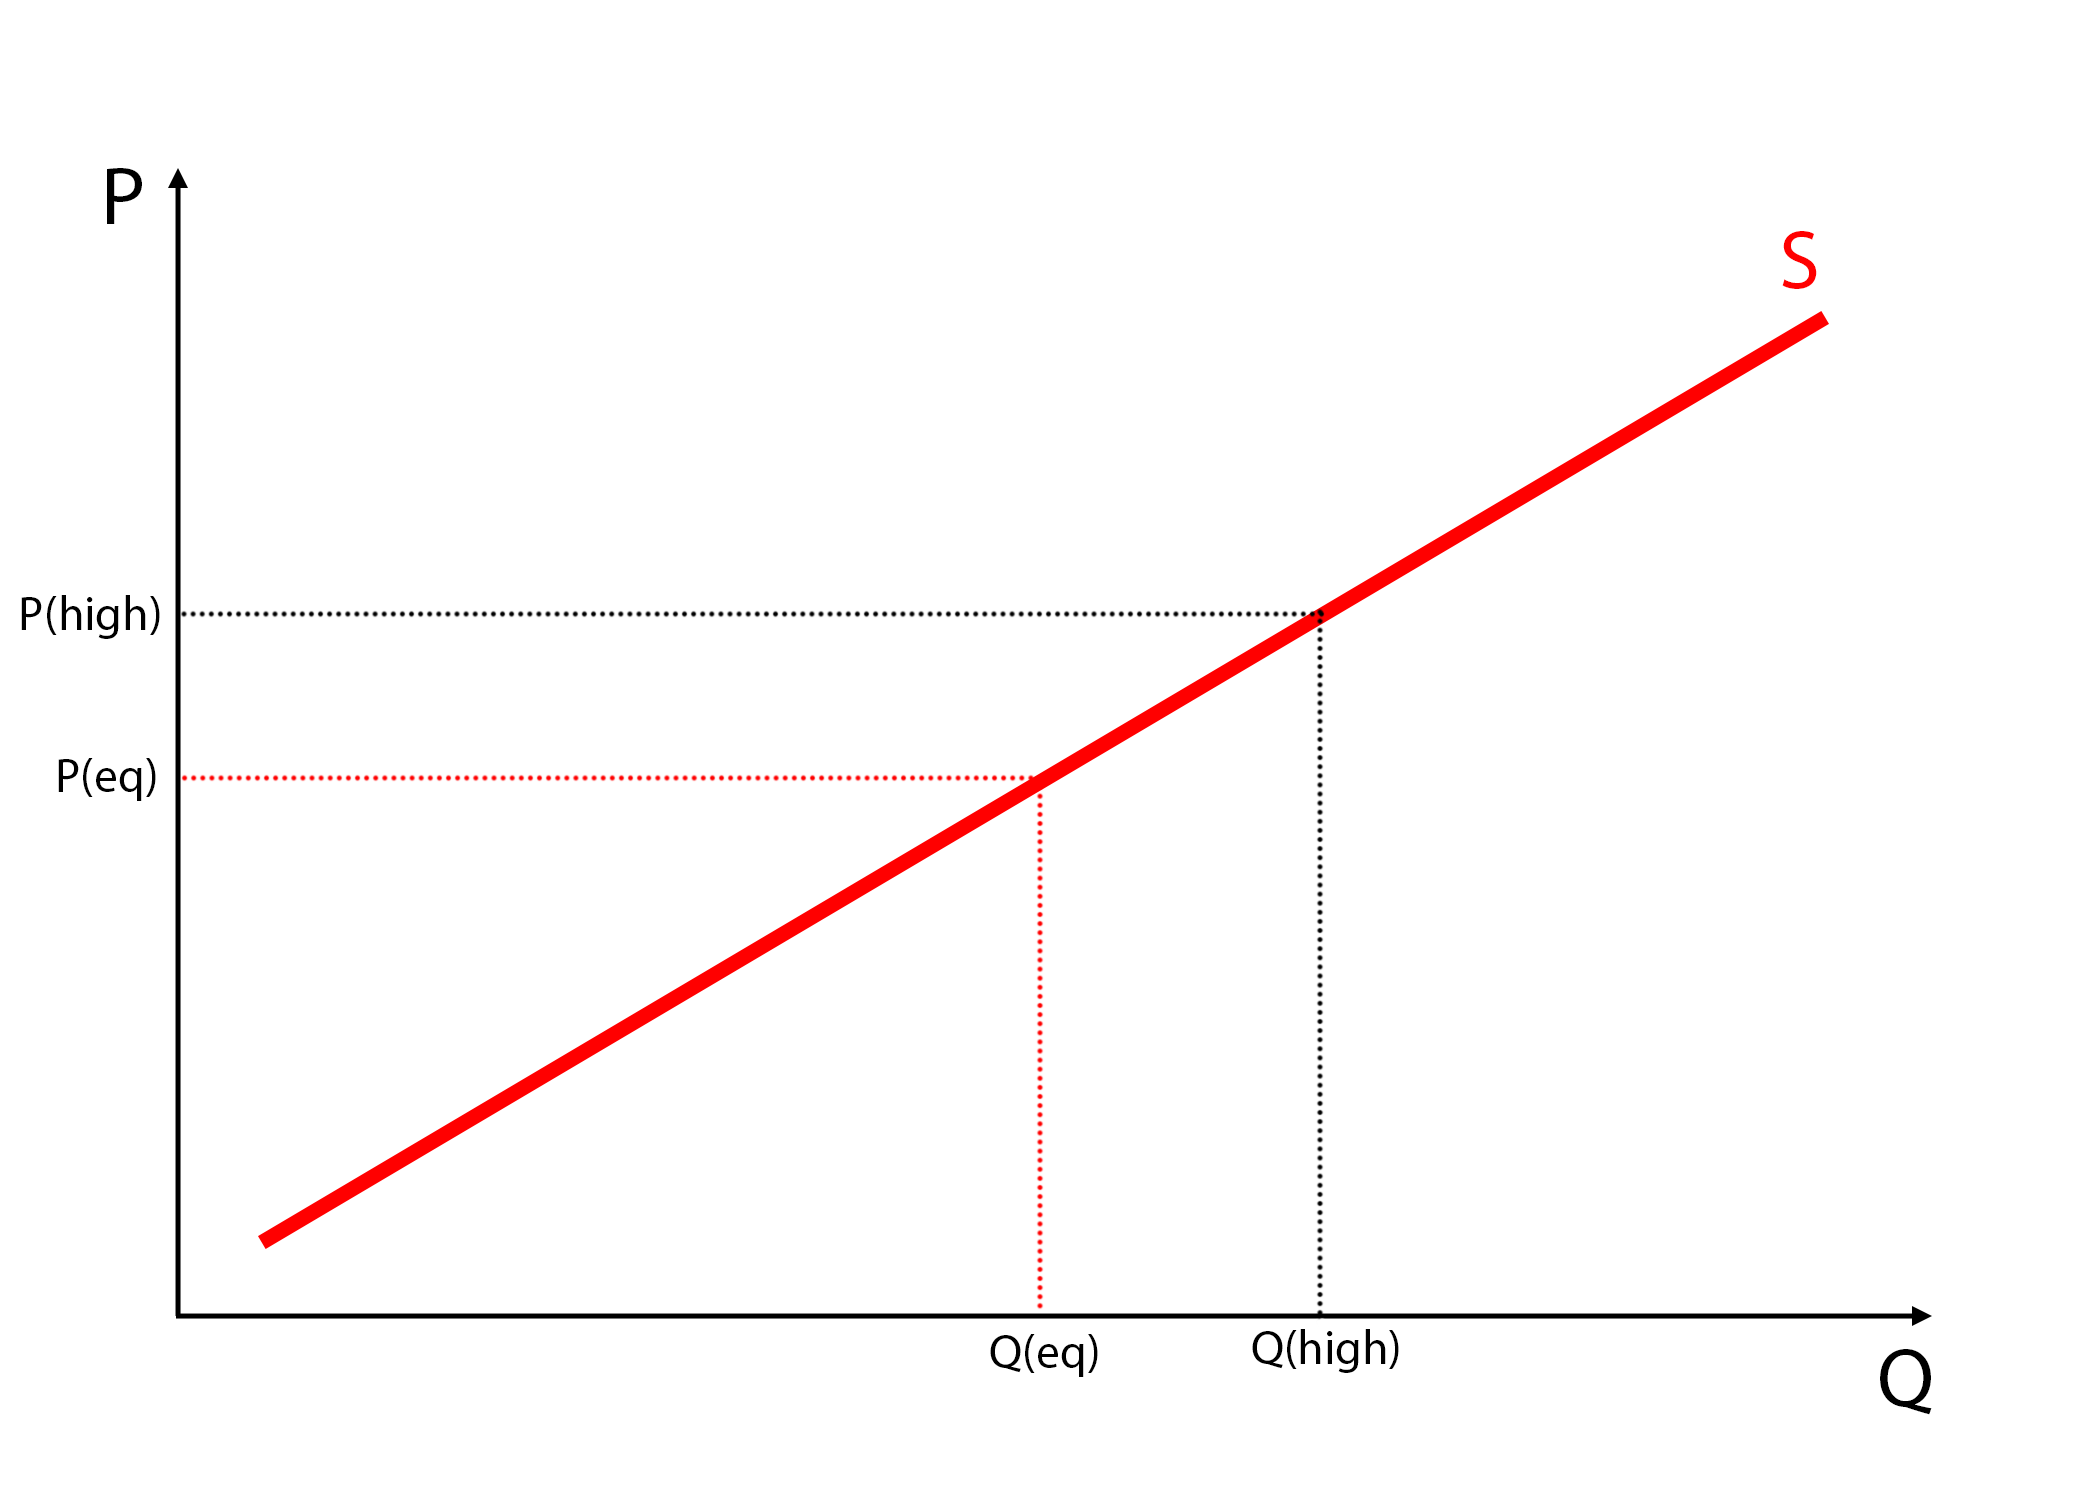
The fact that the supply is higher at higher prices is referred to as the law of supply.
Note how a change in price from P(eq) to P(high) changes the quantity demanded to Q(high) in response.
In other words: as prices increase the supply increases and as prices decrease the supply decreases.
Equilibrium Price and Equilibrium Quantity
To get the equilibrium price and quantity for a good, we use the market supply and demand functions.
The solution for the price is where the quantity demanded equals the quantity supplied.
Graphically, the equilibrium price and quantity are at the point where the demand and supply curves intersect. This is illustrated below.
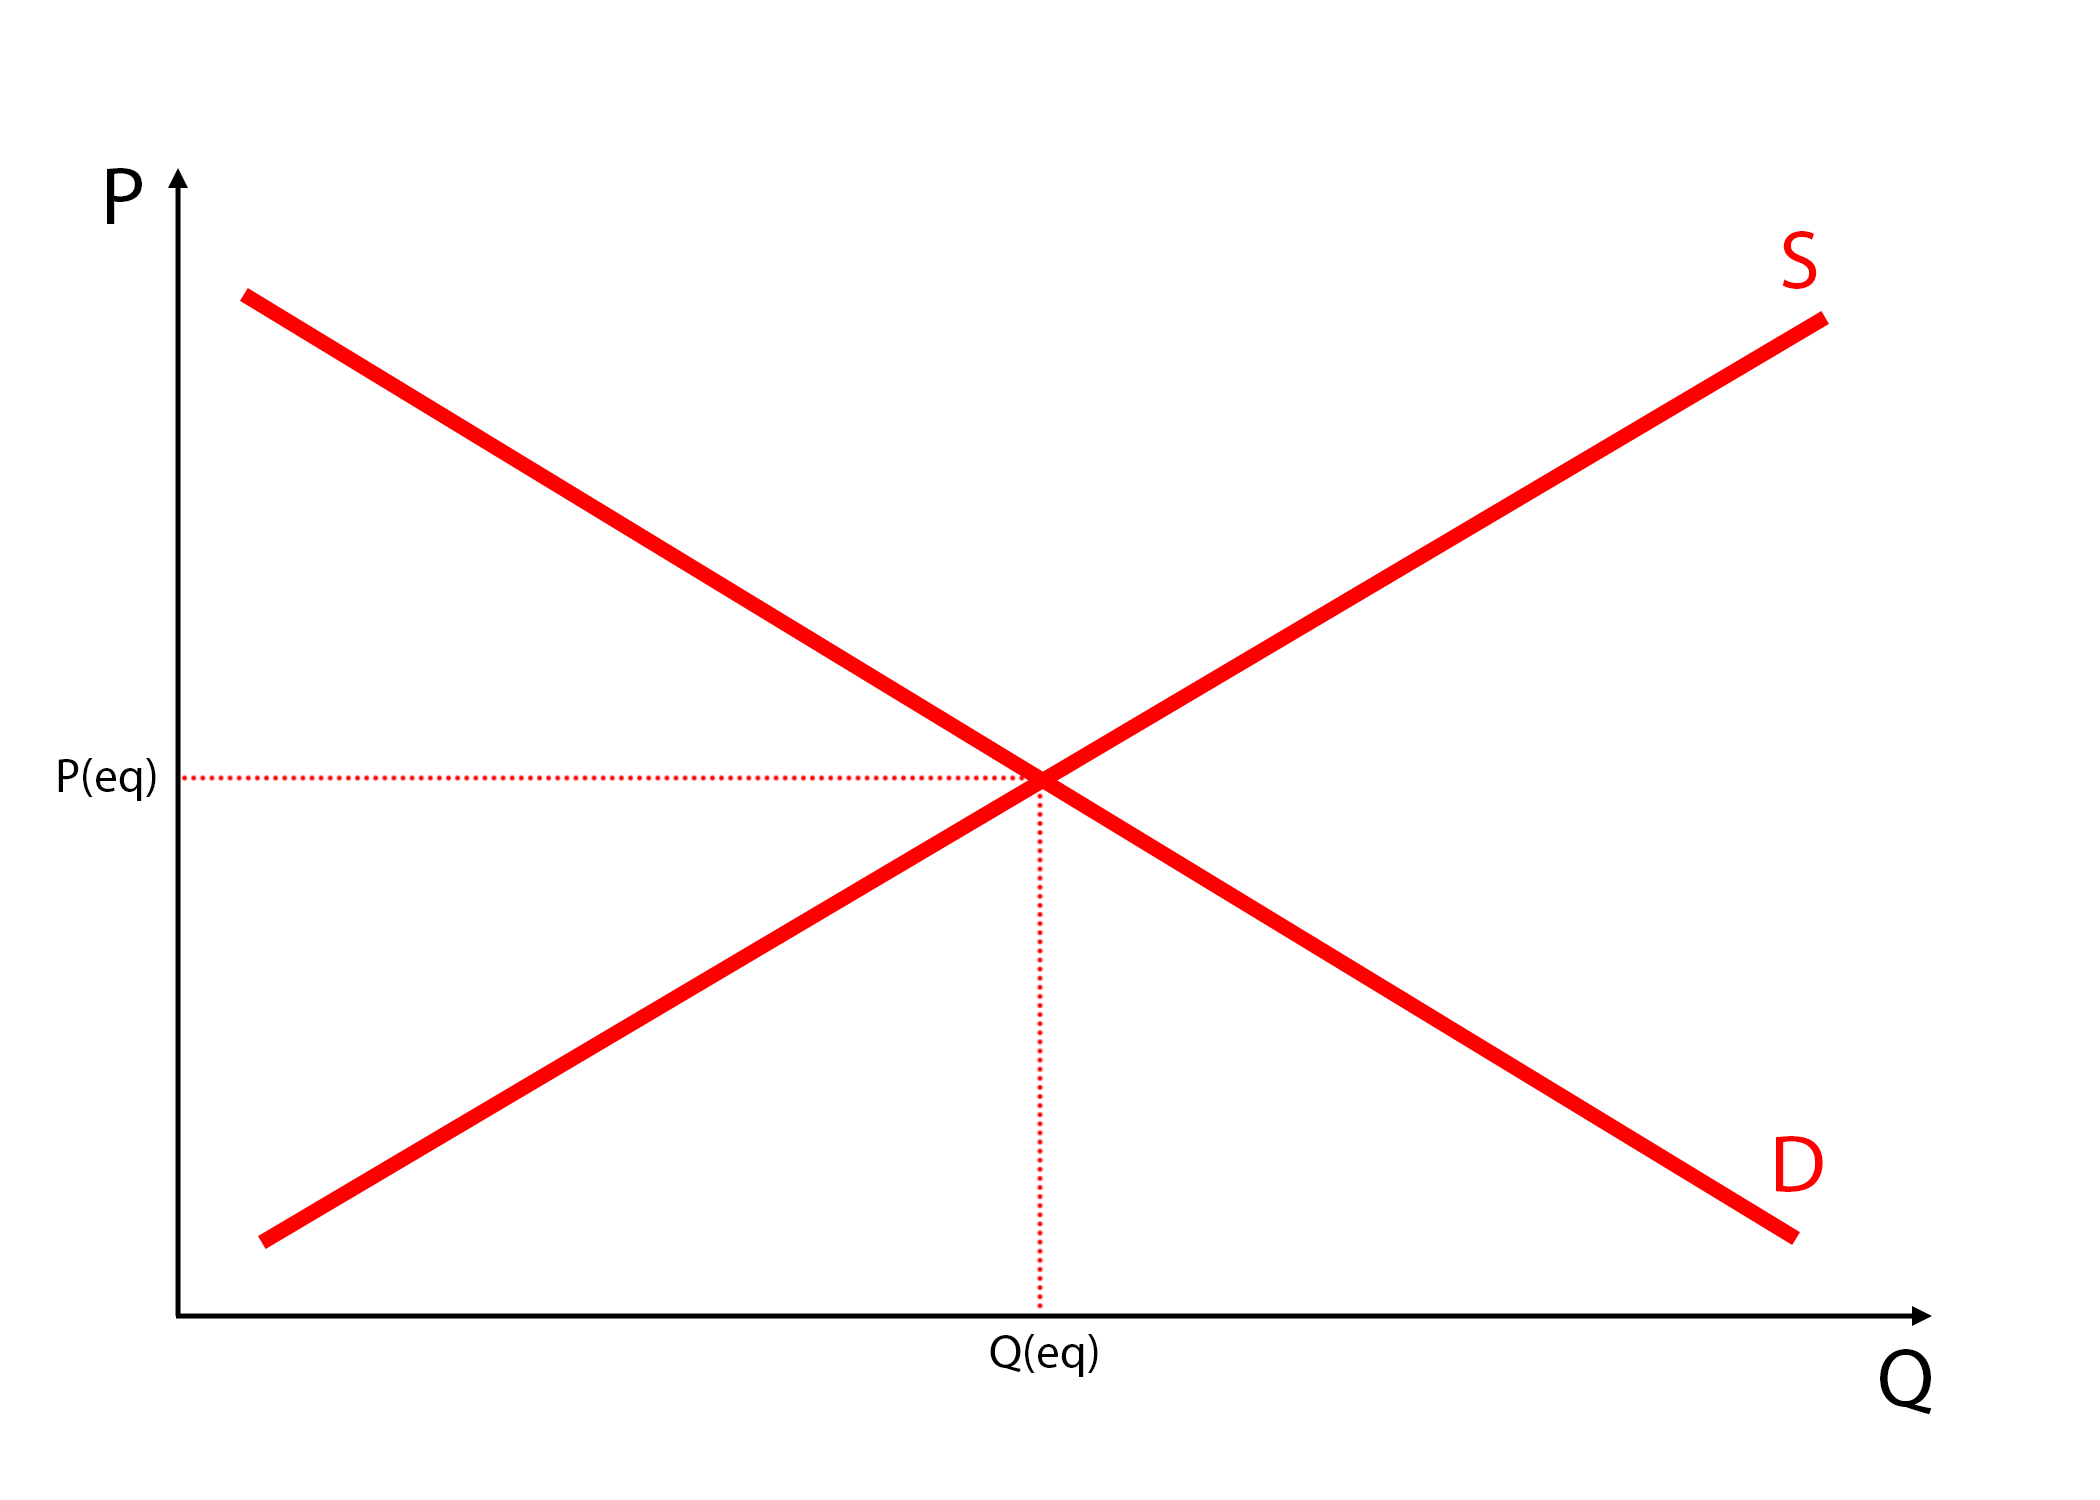
Any deviation will be pushed back to the equilibrium by the market forces.
For example, if some suppliers push the prices down by selling at a lower price, other suppliers will reduce production in response to lower price (creating lack of supply). At the same time, due to the (temporarily) lowered prices, the demand for the good will increase (creating excess demand), making the consumers compete for the limited supply and thus willing to pay more, ultimately resulting in increasing the price back to the equilibrium price.
Same goes for prices pushed above the equilibrium price: if suppliers start selling a good at a higher price, more suplliers will join the gold rush market (creating excess supply). Due to the rising prices, less people will be interested to buy the supplied good (creating lack of demand), which will ultimately result in a price decrease back to the equilibrium.
These activities are observable both from micro and macro-economic perspective.
Can you think of certain cases where you recognized it?
Can an Equilibrium Price Change?
Yes, but not solely by manipulating prices.
It can change due to shifts in the market curves. These shifts in the supply and demand curves occur because of changes in a relevant factor that’s not the price.
Foe example: changes in income levels and prices of substitute and complementary goods (for demand) or prices and availability of input goods, advancements of technology, etc. (for supply).
If you’re a student remember this: price changes are movements along the curves, changes in other factors are shifts of the curves.
Market and Aggregate Supply and Demand
I’ll just scratch the surface here in order to cover some terminology:
Market demand and market supply refer to the sum of quantity demanded or supplied for a good or service at each price across all consumers in the market.
Aggregate demand and aggregate supply refer to the total demand by all consumers or total supply by all suppliers for all goods and services at each price across all markets in an economy.
Afterword
Thoroughly understanding the law of supply and demand can be a life changing experience.
But we barely scratched the surface in this post. That’s why I’ll publish two more posts on supply and demand, where we’ll go even deeper:
- Supply and Demand – An Introduction (the current one)
- Consumer and Producer Surplus & Deadweight Loss
- Obstacles to Efficiency – Taxes, Price Controls, Trade Restrictions
 Husband & Father
  Software Engineer

