
VWCE won the hearts of many European investors due to its suitability for:
- A one-fund portfolio
- Global diversification
- Set-and-forget investing – no rebalancing, no tracking asset allocation.
That’s all great.
However, $VWCE has a TER of 0.22% (plus internal transaction costs and dividend leakage). Many beginners still consider this low-cost. And it is, but not compared to alternative ETFs on the market.
The Problem With “VWCE and Chill”
The problem with the $VWCE and chill strategy is the following:
If you’re in your twenties or even early thirties and already DCAing, eventually you will become a multi-millionaire.
And then, paying 7 times higher TER on a €5-10M portfolio will make a huge difference in absolute terms. Note that this difference may be enough to survive in most countries in the world, at least in terms of bare necessities.
In this post, I’ll provide alternative portfolios that can lower the expenses by more than 85%.
PS I covered this topic previously in Replicating VWCE. This post is a more condensed version for investors that don’t need an introduction to the internal workings of $VWCE.
Portfolio #1: Full Replication (Still Expensive)
The most common alternative investors choose is IWDA + EMIM.
- 89% IWDA (iShares Core MSCI World UCITS ETF), accumulating fund, TER of 0.2%
- 11% EMIM (iShares Core MSCI EM IMI UCITS ETF), accumulating fund, TER of 0.18%
Explanation:
- IWDA is also a globally diversified ETF, but it only tracks the developed markets. It’s also market-cap weighted, so the internal allocation is aligned with the one of DM in VWCE.
- EMIM covers all emerging markets, so there’s no need to look for separate Asia / Middle East / Latin America ETFs. Also, it’s market-cap weighted, so the internal allocation is on point.
This is quite a straight-forward alternative, as we just need to pick $IWDA for the developed markets and $EMIM for the emerging markets.
Given that the EM allocation is quite obvious from the regional exposure of VWCE, constructing this portfolio is quite easy.
If we sum the allocations multiplied by their weights, we get to the total expense ratio of this portfolio:
It has a TER of (89% * 0.2% + 11% * 0.18%).
This is a bit cheaper than VWCE’s 0.22%, but I’d say it’s still expensive.
Portfolio #2: Full Replication (Cheaper)
Here’s an example portfolio that’s almost exactly the same as VWCE:
- 62% VNRA (Vanguard FTSE North America UCITS ETF), accumulating, TER of 0.1%
- 16% IMEA (iShares Core MSCI Europe UCITS ETF), accumulating, TER of 0.12%
- 11% EIMI (iShares Core MSCI EM IMI UCITS ETF), accumulating, TER of 0.18%
- 6% SJPA (iShares MSCI Japan ETF), accumulating, TER of 0.15%
- 5% CPXJ (iShares Core MSCI Pacific ex Japan UCITS ETF), accumulating, TER of 0.15%

Explanation:
- VNRA covers USA and Canada. As it’s also a market-cap weighted index, it means that the internal allocation between the two is on point.
- IMEA covers developed Europe, so that’s self explanatory – we just use the same weight as in $VWCE.
- EIMI (same explanation as in Portfolio #1 above).
- SJPA and CPXJ because I couldn’t find a cheap and accumulating ETF covering both developed Asia-Pacific and Japan. I checked on VWCE’s country distribution that Japan’s allocation is ~6%, so 6% goes to $SJPA and the other 5% to $CPXJ.
Now, for the good part.
If we calculate the TER of this portfolio, we get (62% * 0.1% + 16% * 0.12% + 11% * 0.18% + 6% * 0.15% + 5% * 0.15%)
That’s almost half the cost of VWCE for the same allocation.
Portfolio #3: Replication with Tracking Error
We can optimize the portfolio to decrease the TER even further.
As there aren’t any cheaper ETFs than those in Portfolio #2, we’d need to sacrifice some diversification for price. So the following portfolio won’t cover everything from $VWCE, but will use a sampling strategy to achieve the same (or arguably better) performance.
Now, you, as an investor, need to answer the following question:
If you had to build a portfolio yourself, would you invest in Canada?
My answer to that question would be no.
For me, the Canada exposure is purely a diversification play. Its performance is so correlated to the US market that I’d argue its <3% allocation can be “sacrificed” for good.
Also, we’re already quite diversified across tens of mutually correlated first world countries, so excluding a single one doesn’t really increase the risk.
Thus, in this portfolio, we substitute VNDA (North America) with CSPX – an ETF tracking the US market.
- 62% CSPX (iShares Core S&P 500 UCITS ETF), accumulating, TER of 0.07%
- 16% IMEA (iShares Core MSCI Europe UCITS ETF), accumulating, TER of 0.12%
- 11% EIMI (iShares Core MSCI EM IMI UCITS ETF), accumulating, TER of 0.18%
- 6% SJPA (iShares MSCI Japan ETF), accumulating, TER of 0.15%
- 5% CPXJ (iShares Core MSCI Pacific ex Japan UCITS ETF), accumulating, TER of 0.15%
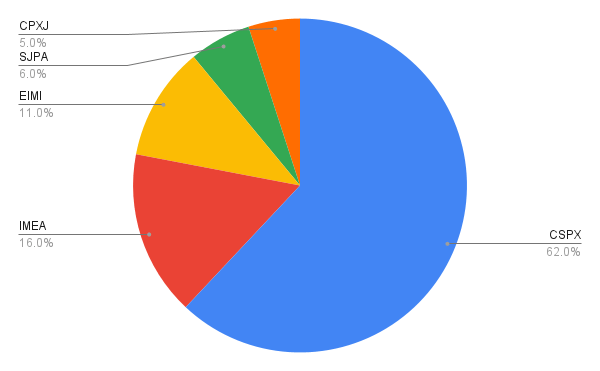
As you see, CSPX has a TER of 0.07 and, with its highest allocation in the portfolio, will lower the total cost even further:
The TER of this portfolio is (62% * 0.07% + 16% * 0.12% + 11% * 0.18% + 6% * 0.15% + 5% * 0.15%).
Officially, less than half the price of $VWCE.
Portfolio #4: Sampling
The only downside of the third portfolio is that it has 5 ETFs.
This is not inherently bad, but it’s 5 times more than what you’d get with $VWCE. So many investors might accept to pay double TER in order not to rebalance quarterly.
Okay.
Let’s see if we can make some more exclusions in order to:
- Make the portfolio less complex to maintain
- Decrease the price even further
So, again, time for you to answer another question:
If you had to build a portfolio yourself, would you invest in Australia?
For very similar reasons as for Canada above, my answer to that question would be no.
However, we cannot really single out Australia, as it’s a part of CPJX, tracking the MSCI Pacific ex Japan index:
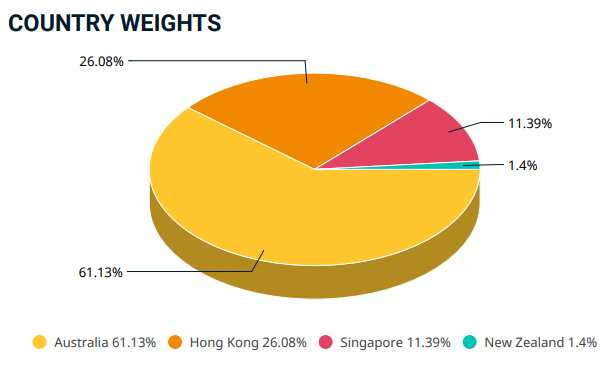
The weight of $CPJX in the portfolio is 5%.
And with Australia being more than 60% of it, the question becomes:
Would you sacrifice ~3% more of your diversification in order to lower your costs and simplify your portfolio?
If the answer to that question is yes, than you’d fully exclude $CPJX and end up with:
- 67% CSPX (iShares Core S&P 500 UCITS ETF), accumulating, TER of 0.07%
- 16% IMEA (iShares Core MSCI Europe UCITS ETF), accumulating, TER of 0.12%
- 11% EIMI (iShares Core MSCI EM IMI UCITS ETF), accumulating, TER of 0.18%
- 6% SJPA (iShares MSCI Japan ETF), accumulating, TER of 0.15%
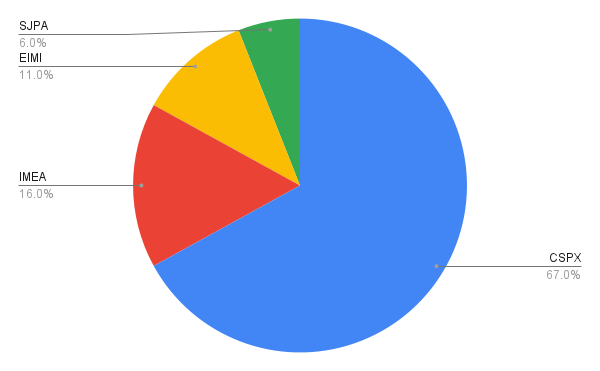
As you notice, the allocation of the excluded countries went in the US market. This makes sense because it has a “first-mover advantage” in performance when compared to the rest of the developed markets. I write more about this in the Core Portfolio Post, so won’t elaborate in detail here.
The TER of this portfolio is
It’s only slightly better than the previous one, but this portfolio wins in simplicity.
And of course, it’s significantly cheaper than $VWCE.
Remember: you don’t need to sacrifice any diversification if you’re uncomfortable with it. But since you’d be saving >50% in fees, you should at least consider it.
Portfolio #5: Further Simplification
There’s another point to cover with the investor that still wants to make his portfolio cheaper and less complex:
Enter Japan.
I guess you already know where this is going.
Japan is currently the third largest economy in the world, right after USA and China. Also, it’s less correlated with the rest of the developed markets than they’re to one-another.
On the other hand though, its performance in the last decades hasn’t been stellar. Below is the Nikkei 225 index since the 1990s:
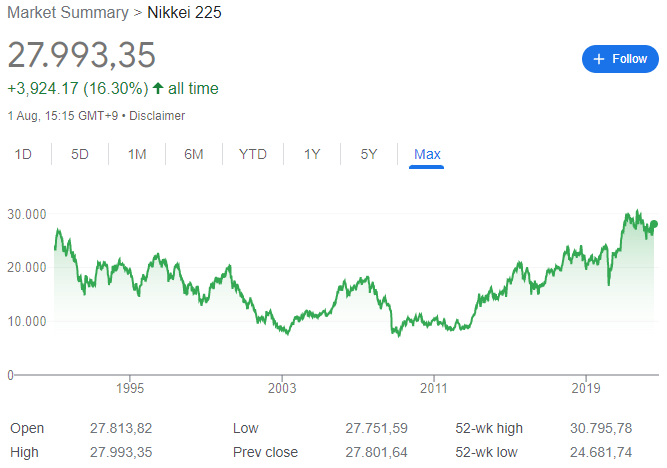
Of course, nobody can predict with absolute certainty if this will continue or Japan is entering a decade-long uptrend.
We all know that history is not an indicator for future results.
But that’s why we’re adding a personal preference. And the question becomes:
Would you exclude Japan’s market in the name of having a three-fund portfolio that’s cheaper?
I can’t and won’t answer that question for you. But I know that many would. And then the portfolio becomes:
- 73% CSPX (iShares Core S&P 500 UCITS ETF), accumulating, TER of 0.07%
- 16% IMEA (iShares Core MSCI Europe UCITS ETF), accumulating, TER of 0.12%
- 11% EIMI (iShares Core MSCI EM IMI UCITS ETF), accumulating, TER of 0.18%
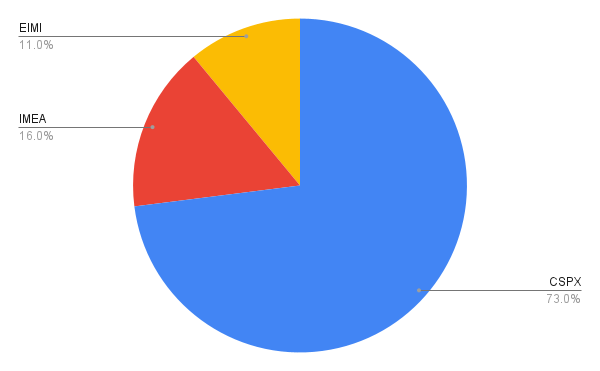
Now, the portfolio becomes a simple distribution of US, EU, and emerging markets.
The total expense ratio of this portfolio is
Portfolio #6: Concentrate and Outperform
On a multi-year time frame, the S&P continuously outperforms broad indices from any other region in the world, including global ones. Both in thriving markets and in a downturn.
At the same time, all developed countries’ markets are highly correlated with the US markets and policy.
As such, an argument can be made that EU’s stability, regulations, and socialist tendencies are an unnecessary exposure. Also, some investors might feel that an emerging markets exposure of 11% might be quite high given their uncertainty and historical underperformance. I’d be surprised to see any of the two having a stellar performance on ongoing basis, especially compared to the S&P 500 as a benchmark.
The reality is that the United States of America is the country that leads in terms of innovation, technological development, and productivity.
More details about my reasoning in Core Portfolio for European Investors.
And for a US portfolio, we can do even cheaper than CSPX by using SPYL (SPDR Core S&P 500 UCITS ETF) – an ETF with almost the same characteristics as CSPX, but a lower TER. See a detailed comparison in my post CSPX vs SPYL – What is The Best US ETF.
Finally, the concentrate and outperform portfolio looks like this:
- 100% SPYL (SPDR Core S&P 500 UCITS ETF), accumulating, TER of 0.03%
Conclusion
Of course, due to the difference in allocation, there will be some “tracking error” compared to $VWCE… But:
- It’s to the upside – the S&P outperforms the MSCI World and the FTSE All-World historically
- It costs 0.03% vs 0.22% per year – this portfolio is 7 times cheaper than VWCE
And interestingly, it’s still a one fund portfolio.
I think that an investor can concentrate even more and achieve even better performance, but tracking the S&P 500 is the furthest we can go while still doing index investing.
For more intermediate posts on investing from Europe, visit: EU Investors Handbook.
If you found these topics too advanced, visit the free How to Start Investing: A Complete Beginner Series.
Author
-

D. Petkovski
📓 The Author Husband & Father
Software Engineer StrengthCentric
 ₿itcoin Hodler Long-Term Investor
🌍 Everything Enthusiast 🔥 Optimist
 Husband & Father
  Software Engineer

Related posts:
 IWDA vs VWCE and VWRL (For European Investors)
 Replicating VWCE – Optimize for Cost and Performance
 Dividend Investing is for Suckers!
 Accumulating vs Distributing ETFs
 Why the Stock Market Always Goes Up?
 Asset Allocation – Finding Your Ideal Distribution
 Stock Market Index – Explanation and Examples
 The Best Emerging Market ETF for Europeans
 Investment Taxes in ALL EU Countries (2024)
 5 Steps to Overcome Investing Fear
 Market Order vs Limit Order – Placing Orders Tutorial
 IWDA vs SWDA – What’s The Difference?
 Receive Tax Free Dividends in The Netherlands
 Sector Boost With QDVE For ETF Investors
 SPYL vs SPY5 – What to Choose and Why?